

11.4 Helium Stars
233
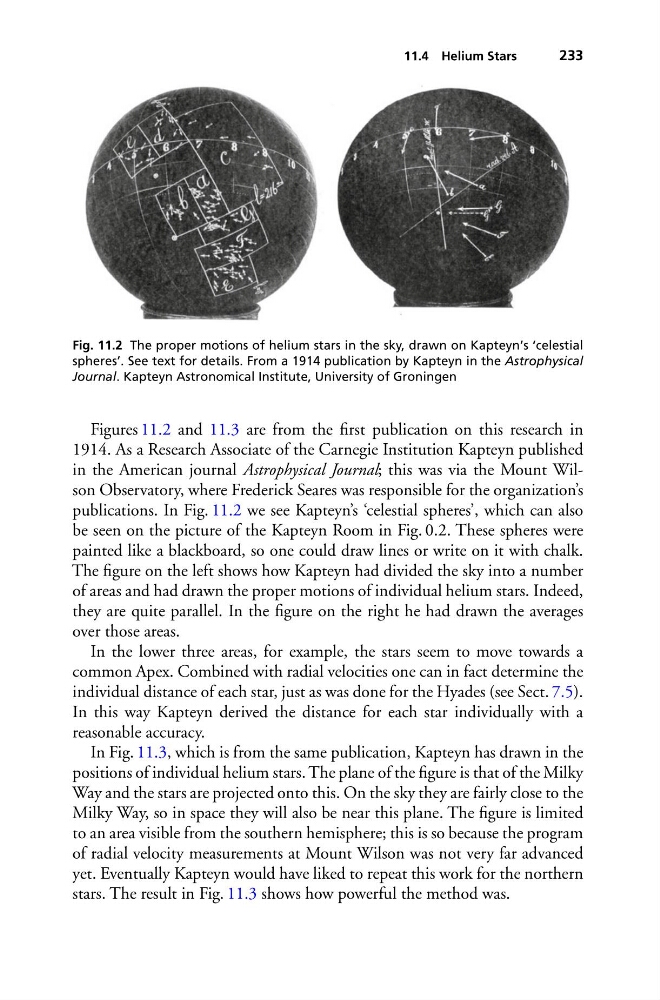
Fig. 11.2 The proper motions of helium stars in the sky, drawn on Kapteyn’s ‘celestial
spheres’. See text for details. From a 1914 publication by Kapteyn in the Astrophysical
Journal. Kapteyn Astronomical Institute, University of Groningen
Figures 11.2 and 11.3 are from the first publication on this research in
1914. As a Research Associate of the Carnegie Institution Kapteyn published
in the American journal Astrophysical Journal; this was via the Mount Wilson Observatory, where Frederick Seares was responsible for the organization’s
publications. In Fig. 11.2 we see Kapteyn’s ‘celestial spheres’, which can also
be seen on the picture of the Kapteyn Room in Fig. 0.2. These spheres were
painted like a blackboard, so one could draw lines or write on it with chalk.
The figure on the left shows how Kapteyn had divided the sky into a number
of areas and had drawn the proper motions of individual helium stars. Indeed,
they are quite parallel. In the figure on the right he had drawn the averages
over those areas.
In the lower three areas, for example, the stars seem to move towards a
common Apex. Combined with radial velocities one can in fact determine the
individual distance of each star, just as was done for the Hyades (see Sect. 7.5).
In this way Kapteyn derived the distance for each star individually with a
reasonable accuracy.
In Fig. 11.3, which is from the same publication, Kapteyn has drawn in the
positions of individual helium stars. The plane of the figure is that of the Milky
Way and the stars are projected onto this. On the sky they are fairly close to the
Milky Way, so in space they will also be near this plane. The figure is limited
to an area visible from the southern hemisphere; this is so because the program
of radial velocity measurements at Mount Wilson was not very far advanced
yet. Eventually Kapteyn would have liked to repeat this work for the northern
stars. The result in Fig. 11.3 shows how powerful the method was.
233
Fig. 11.2 The proper motions of helium stars in the sky, drawn on Kapteyn’s ‘celestial
spheres’. See text for details. From a 1914 publication by Kapteyn in the Astrophysical
Journal. Kapteyn Astronomical Institute, University of Groningen
Figures 11.2 and 11.3 are from the first publication on this research in
1914. As a Research Associate of the Carnegie Institution Kapteyn published
in the American journal Astrophysical Journal; this was via the Mount Wilson Observatory, where Frederick Seares was responsible for the organization’s
publications. In Fig. 11.2 we see Kapteyn’s ‘celestial spheres’, which can also
be seen on the picture of the Kapteyn Room in Fig. 0.2. These spheres were
painted like a blackboard, so one could draw lines or write on it with chalk.
The figure on the left shows how Kapteyn had divided the sky into a number
of areas and had drawn the proper motions of individual helium stars. Indeed,
they are quite parallel. In the figure on the right he had drawn the averages
over those areas.
In the lower three areas, for example, the stars seem to move towards a
common Apex. Combined with radial velocities one can in fact determine the
individual distance of each star, just as was done for the Hyades (see Sect. 7.5).
In this way Kapteyn derived the distance for each star individually with a
reasonable accuracy.
In Fig. 11.3, which is from the same publication, Kapteyn has drawn in the
positions of individual helium stars. The plane of the figure is that of the Milky
Way and the stars are projected onto this. On the sky they are fairly close to the
Milky Way, so in space they will also be near this plane. The figure is limited
to an area visible from the southern hemisphere; this is so because the program
of radial velocity measurements at Mount Wilson was not very far advanced
yet. Eventually Kapteyn would have liked to repeat this work for the northern
stars. The result in Fig. 11.3 shows how powerful the method was.