

130
7 Star Streams
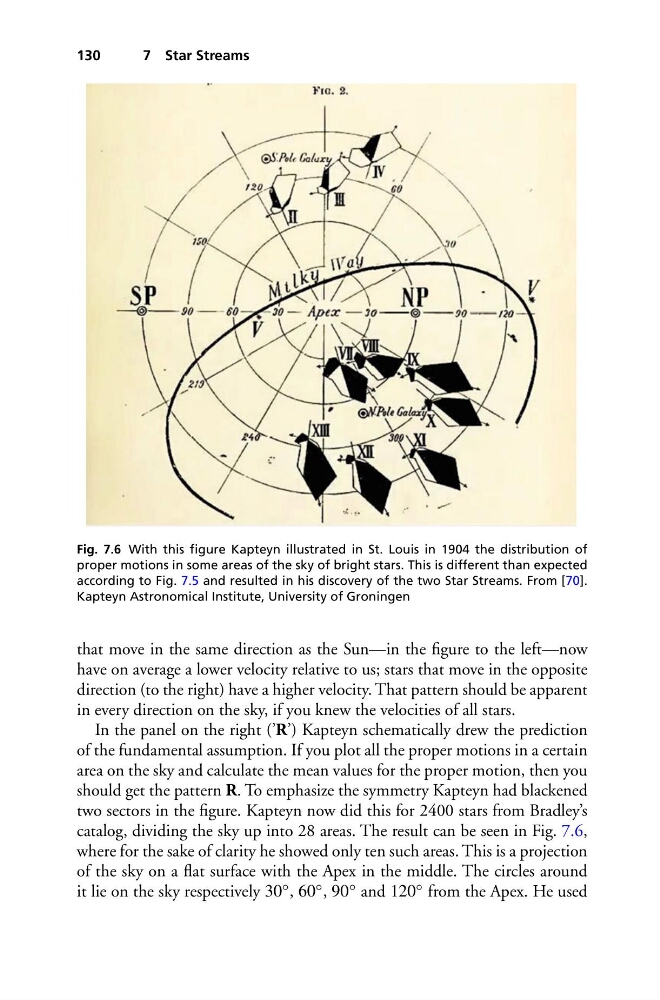
Fig. 7.6 With this figure Kapteyn illustrated in St. Louis in 1904 the distribution of
proper motions in some areas of the sky of bright stars. This is different than expected
according to Fig. 7.5 and resulted in his discovery of the two Star Streams. From [70].
Kapteyn Astronomical Institute, University of Groningen
that move in the same direction as the Sun—in the figure to the left—now
have on average a lower velocity relative to us; stars that move in the opposite
direction (to the right) have a higher velocity. That pattern should be apparent
in every direction on the sky, if you knew the velocities of all stars.
In the panel on the right (’R’) Kapteyn schematically drew the prediction
of the fundamental assumption. If you plot all the proper motions in a certain
area on the sky and calculate the mean values for the proper motion, then you
should get the pattern R. To emphasize the symmetry Kapteyn had blackened
two sectors in the figure. Kapteyn now did this for 2400 stars from Bradley’s
catalog, dividing the sky up into 28 areas. The result can be seen in Fig. 7.6,
where for the sake of clarity he showed only ten such areas. This is a projection
of the sky on a flat surface with the Apex in the middle. The circles around
it lie on the sky respectively 30 ◦ , 60 ◦ , 90 ◦ and 120 ◦ from the Apex. He used
7 Star Streams
Fig. 7.6 With this figure Kapteyn illustrated in St. Louis in 1904 the distribution of
proper motions in some areas of the sky of bright stars. This is different than expected
according to Fig. 7.5 and resulted in his discovery of the two Star Streams. From [70].
Kapteyn Astronomical Institute, University of Groningen
that move in the same direction as the Sun—in the figure to the left—now
have on average a lower velocity relative to us; stars that move in the opposite
direction (to the right) have a higher velocity. That pattern should be apparent
in every direction on the sky, if you knew the velocities of all stars.
In the panel on the right (’R’) Kapteyn schematically drew the prediction
of the fundamental assumption. If you plot all the proper motions in a certain
area on the sky and calculate the mean values for the proper motion, then you
should get the pattern R. To emphasize the symmetry Kapteyn had blackened
two sectors in the figure. Kapteyn now did this for 2400 stars from Bradley’s
catalog, dividing the sky up into 28 areas. The result can be seen in Fig. 7.6,
where for the sake of clarity he showed only ten such areas. This is a projection
of the sky on a flat surface with the Apex in the middle. The circles around
it lie on the sky respectively 30 ◦ , 60 ◦ , 90 ◦ and 120 ◦ from the Apex. He used