

70
3 A Structuring Regime to Control Bubbling Beds
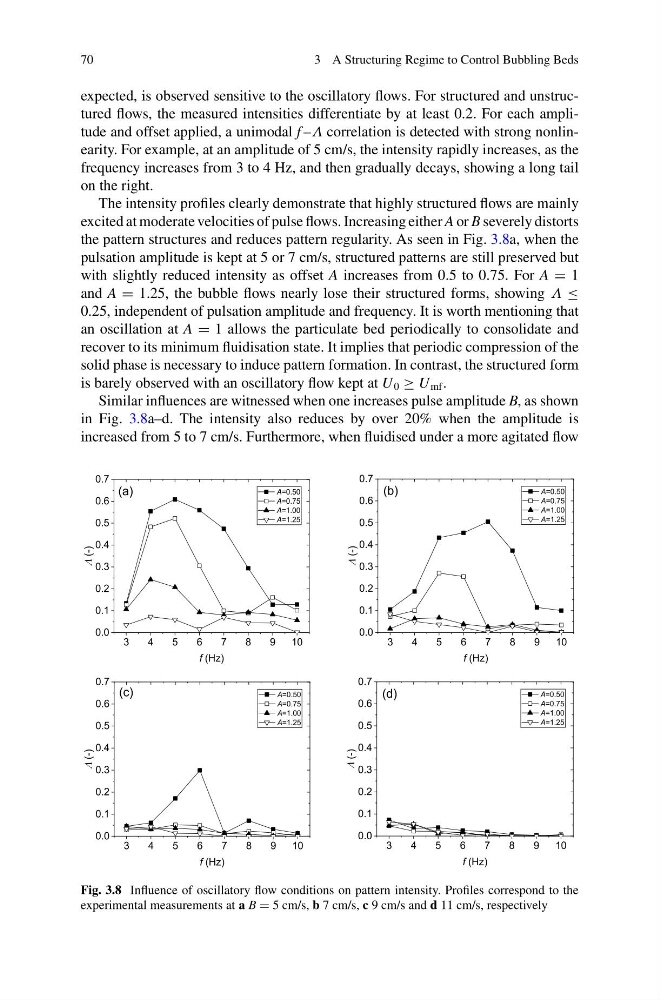
expected, is observed sensitive to the oscillatory flows. For structured and unstructured flows, the measured intensities differentiate by at least 0.2. For each amplitude and offset applied, a unimodal f –Λ correlation is detected with strong nonlinearity. For example, at an amplitude of 5 cm/s, the intensity rapidly increases, as the
frequency increases from 3 to 4 Hz, and then gradually decays, showing a long tail
on the right.
The intensity profiles clearly demonstrate that highly structured flows are mainly
excited at moderate velocities of pulse flows. Increasing either A or B severely distorts
the pattern structures and reduces pattern regularity. As seen in Fig. 3.8a, when the
pulsation amplitude is kept at 5 or 7 cm/s, structured patterns are still preserved but
with slightly reduced intensity as offset A increases from 0.5 to 0.75. For A = 1
and A = 1.25, the bubble flows nearly lose their structured forms, showing Λ ≤
0.25, independent of pulsation amplitude and frequency. It is worth mentioning that
an oscillation at A = 1 allows the particulate bed periodically to consolidate and
recover to its minimum fluidisation state. It implies that periodic compression of the
solid phase is necessary to induce pattern formation. In contrast, the structured form
is barely observed with an oscillatory flow kept at U 0 ≥ U mf .
Similar influences are witnessed when one increases pulse amplitude B, as shown
in Fig. 3.8a–d. The intensity also reduces by over 20% when the amplitude is
increased from 5 to 7 cm/s. Furthermore, when fluidised under a more agitated flow
Fig. 3.8 Influence of oscillatory flow conditions on pattern intensity. Profiles correspond to the
experimental measurements at a B = 5 cm/s, b 7 cm/s, c 9 cm/s and d 11 cm/s, respectively
3 A Structuring Regime to Control Bubbling Beds
expected, is observed sensitive to the oscillatory flows. For structured and unstructured flows, the measured intensities differentiate by at least 0.2. For each amplitude and offset applied, a unimodal f –Λ correlation is detected with strong nonlinearity. For example, at an amplitude of 5 cm/s, the intensity rapidly increases, as the
frequency increases from 3 to 4 Hz, and then gradually decays, showing a long tail
on the right.
The intensity profiles clearly demonstrate that highly structured flows are mainly
excited at moderate velocities of pulse flows. Increasing either A or B severely distorts
the pattern structures and reduces pattern regularity. As seen in Fig. 3.8a, when the
pulsation amplitude is kept at 5 or 7 cm/s, structured patterns are still preserved but
with slightly reduced intensity as offset A increases from 0.5 to 0.75. For A = 1
and A = 1.25, the bubble flows nearly lose their structured forms, showing Λ ≤
0.25, independent of pulsation amplitude and frequency. It is worth mentioning that
an oscillation at A = 1 allows the particulate bed periodically to consolidate and
recover to its minimum fluidisation state. It implies that periodic compression of the
solid phase is necessary to induce pattern formation. In contrast, the structured form
is barely observed with an oscillatory flow kept at U 0 ≥ U mf .
Similar influences are witnessed when one increases pulse amplitude B, as shown
in Fig. 3.8a–d. The intensity also reduces by over 20% when the amplitude is
increased from 5 to 7 cm/s. Furthermore, when fluidised under a more agitated flow
Fig. 3.8 Influence of oscillatory flow conditions on pattern intensity. Profiles correspond to the
experimental measurements at a B = 5 cm/s, b 7 cm/s, c 9 cm/s and d 11 cm/s, respectively