

42
2 Bubbling Properties in Pulsed Fluidised Beds
0.0
0.5
1.0
1.5
2.0
2.5
3.0
6cm/s
8cm/s
10cm/s
Lateral position (cm)
(a)
Mean bubble size (cm)
0
15
30
45
0
1 5
3 0
4 5
0
300
600
900
1200
1500
6cm/s
8cm/s
10cm/s
Lateral position (cm)
(b)
Accumulated bubble area (cm
2
)
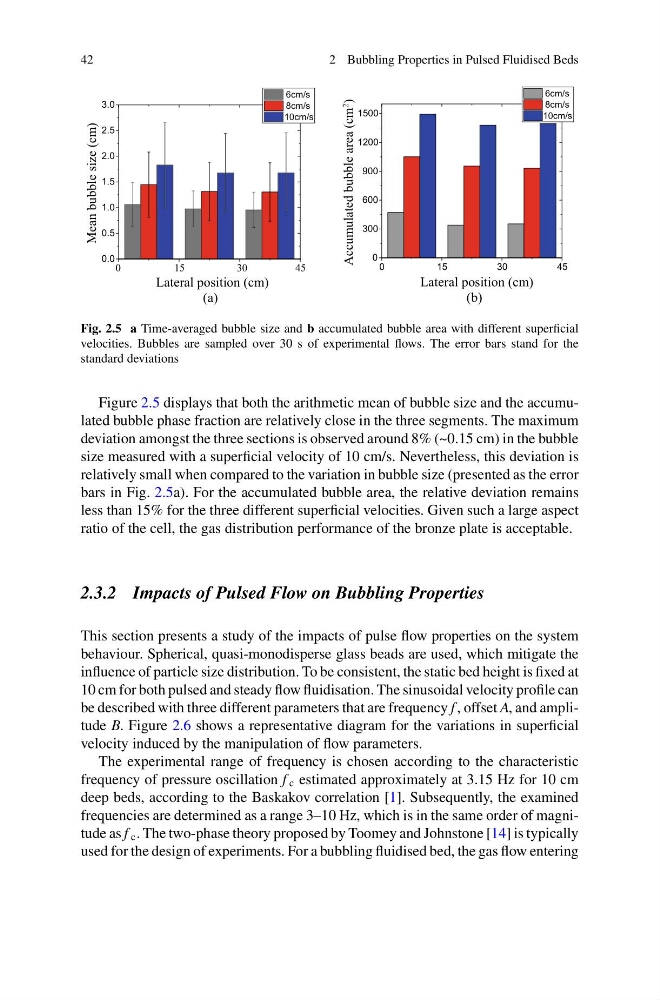
Fig. 2.5 a Time-averaged bubble size and b accumulated bubble area with different superficial
velocities. Bubbles are sampled over 30 s of experimental flows. The error bars stand for the
standard deviations
Figure 2.5 displays that both the arithmetic mean of bubble size and the accumulated bubble phase fraction are relatively close in the three segments. The maximum
deviation amongst the three sections is observed around 8% (~0.15 cm) in the bubble
size measured with a superficial velocity of 10 cm/s. Nevertheless, this deviation is
relatively small when compared to the variation in bubble size (presented as the error
bars in Fig. 2.5a). For the accumulated bubble area, the relative deviation remains
less than 15% for the three different superficial velocities. Given such a large aspect
ratio of the cell, the gas distribution performance of the bronze plate is acceptable.
2.3.2 Impacts of Pulsed Flow on Bubbling Properties
This section presents a study of the impacts of pulse flow properties on the system
behaviour. Spherical, quasi-monodisperse glass beads are used, which mitigate the
influence of particle size distribution. To be consistent, the static bed height is fixed at
10 cm for both pulsed and steady flow fluidisation. The sinusoidal velocity profile can
be described with three different parameters that are frequency f , offset A, and amplitude B. Figure 2.6 shows a representative diagram for the variations in superficial
velocity induced by the manipulation of flow parameters.
The experimental range of frequency is chosen according to the characteristic
frequency of pressure oscillation f c estimated approximately at 3.15 Hz for 10 cm
deep beds, according to the Baskakov correlation [1]. Subsequently, the examined
frequencies are determined as a range 3–10 Hz, which is in the same order of magnitude as f c . The two-phase theory proposed by Toomey and Johnstone [14] is typically
used for the design of experiments. For a bubbling fluidised bed, the gas flow entering
2 Bubbling Properties in Pulsed Fluidised Beds
0.0
0.5
1.0
1.5
2.0
2.5
3.0
6cm/s
8cm/s
10cm/s
Lateral position (cm)
(a)
Mean bubble size (cm)
0
15
30
45
0
1 5
3 0
4 5
0
300
600
900
1200
1500
6cm/s
8cm/s
10cm/s
Lateral position (cm)
(b)
Accumulated bubble area (cm
2
)
Fig. 2.5 a Time-averaged bubble size and b accumulated bubble area with different superficial
velocities. Bubbles are sampled over 30 s of experimental flows. The error bars stand for the
standard deviations
Figure 2.5 displays that both the arithmetic mean of bubble size and the accumulated bubble phase fraction are relatively close in the three segments. The maximum
deviation amongst the three sections is observed around 8% (~0.15 cm) in the bubble
size measured with a superficial velocity of 10 cm/s. Nevertheless, this deviation is
relatively small when compared to the variation in bubble size (presented as the error
bars in Fig. 2.5a). For the accumulated bubble area, the relative deviation remains
less than 15% for the three different superficial velocities. Given such a large aspect
ratio of the cell, the gas distribution performance of the bronze plate is acceptable.
2.3.2 Impacts of Pulsed Flow on Bubbling Properties
This section presents a study of the impacts of pulse flow properties on the system
behaviour. Spherical, quasi-monodisperse glass beads are used, which mitigate the
influence of particle size distribution. To be consistent, the static bed height is fixed at
10 cm for both pulsed and steady flow fluidisation. The sinusoidal velocity profile can
be described with three different parameters that are frequency f , offset A, and amplitude B. Figure 2.6 shows a representative diagram for the variations in superficial
velocity induced by the manipulation of flow parameters.
The experimental range of frequency is chosen according to the characteristic
frequency of pressure oscillation f c estimated approximately at 3.15 Hz for 10 cm
deep beds, according to the Baskakov correlation [1]. Subsequently, the examined
frequencies are determined as a range 3–10 Hz, which is in the same order of magnitude as f c . The two-phase theory proposed by Toomey and Johnstone [14] is typically
used for the design of experiments. For a bubbling fluidised bed, the gas flow entering