

38
2 Bubbling Properties in Pulsed Fluidised Beds
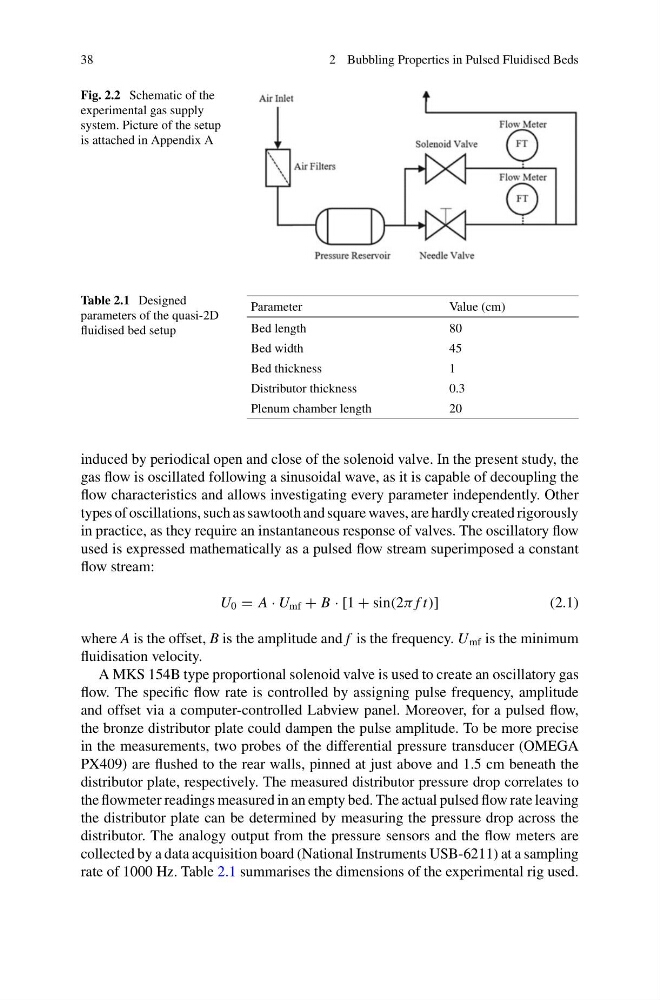
Fig. 2.2 Schematic of the
experimental gas supply
system. Picture of the setup
is attached in Appendix A
Table 2.1 Designed
parameters of the quasi-2D
fluidised bed setup
Parameter
Value (cm)
Bed length
80
Bed width
45
Bed thickness
1
Distributor thickness
0.3
Plenum chamber length
20
induced by periodical open and close of the solenoid valve. In the present study, the
gas flow is oscillated following a sinusoidal wave, as it is capable of decoupling the
flow characteristics and allows investigating every parameter independently. Other
types of oscillations, such as sawtooth and square waves, are hardly created rigorously
in practice, as they require an instantaneous response of valves. The oscillatory flow
used is expressed mathematically as a pulsed flow stream superimposed a constant
flow stream:
U 0 = A · U mf + B · [1 + sin(2π f t)]
(2.1)
where A is the offset, B is the amplitude and f is the frequency. U mf is the minimum
fluidisation velocity.
A MKS 154B type proportional solenoid valve is used to create an oscillatory gas
flow. The specific flow rate is controlled by assigning pulse frequency, amplitude
and offset via a computer-controlled Labview panel. Moreover, for a pulsed flow,
the bronze distributor plate could dampen the pulse amplitude. To be more precise
in the measurements, two probes of the differential pressure transducer (OMEGA
PX409) are flushed to the rear walls, pinned at just above and 1.5 cm beneath the
distributor plate, respectively. The measured distributor pressure drop correlates to
the flowmeter readings measured in an empty bed. The actual pulsed flow rate leaving
the distributor plate can be determined by measuring the pressure drop across the
distributor. The analogy output from the pressure sensors and the flow meters are
collected by a data acquisition board (National Instruments USB-6211) at a sampling
rate of 1000 Hz. Table 2.1 summarises the dimensions of the experimental rig used.
2 Bubbling Properties in Pulsed Fluidised Beds
Fig. 2.2 Schematic of the
experimental gas supply
system. Picture of the setup
is attached in Appendix A
Table 2.1 Designed
parameters of the quasi-2D
fluidised bed setup
Parameter
Value (cm)
Bed length
80
Bed width
45
Bed thickness
1
Distributor thickness
0.3
Plenum chamber length
20
induced by periodical open and close of the solenoid valve. In the present study, the
gas flow is oscillated following a sinusoidal wave, as it is capable of decoupling the
flow characteristics and allows investigating every parameter independently. Other
types of oscillations, such as sawtooth and square waves, are hardly created rigorously
in practice, as they require an instantaneous response of valves. The oscillatory flow
used is expressed mathematically as a pulsed flow stream superimposed a constant
flow stream:
U 0 = A · U mf + B · [1 + sin(2π f t)]
(2.1)
where A is the offset, B is the amplitude and f is the frequency. U mf is the minimum
fluidisation velocity.
A MKS 154B type proportional solenoid valve is used to create an oscillatory gas
flow. The specific flow rate is controlled by assigning pulse frequency, amplitude
and offset via a computer-controlled Labview panel. Moreover, for a pulsed flow,
the bronze distributor plate could dampen the pulse amplitude. To be more precise
in the measurements, two probes of the differential pressure transducer (OMEGA
PX409) are flushed to the rear walls, pinned at just above and 1.5 cm beneath the
distributor plate, respectively. The measured distributor pressure drop correlates to
the flowmeter readings measured in an empty bed. The actual pulsed flow rate leaving
the distributor plate can be determined by measuring the pressure drop across the
distributor. The analogy output from the pressure sensors and the flow meters are
collected by a data acquisition board (National Instruments USB-6211) at a sampling
rate of 1000 Hz. Table 2.1 summarises the dimensions of the experimental rig used.