

1.5 Dynamic Patterns in Shallow Granular Layers
23
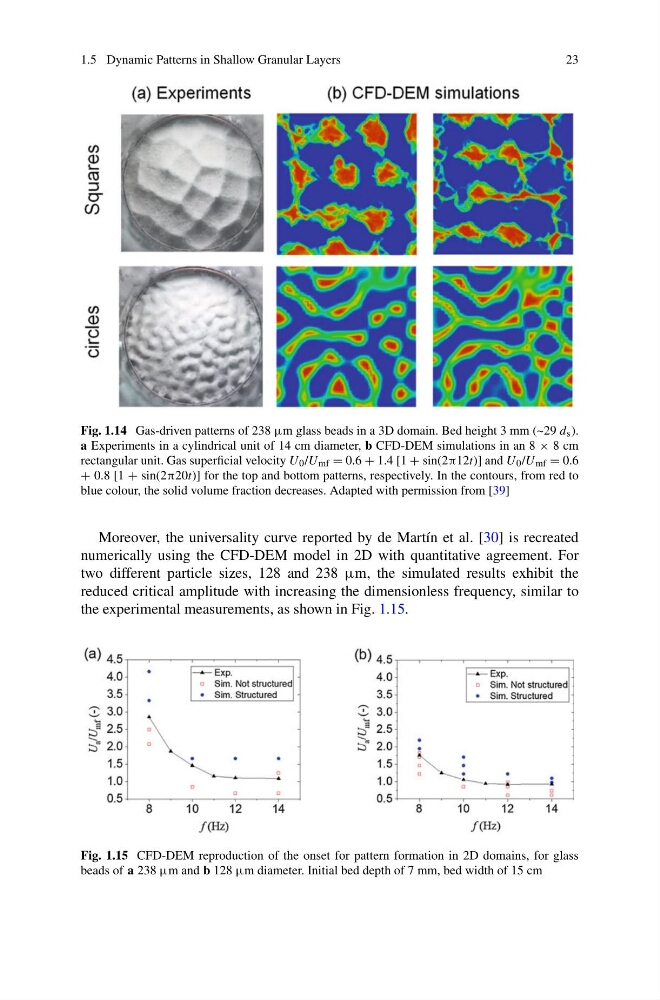
Fig. 1.14 Gas-driven patterns of 238 μm glass beads in a 3D domain. Bed height 3 mm (~29 d s ).
a Experiments in a cylindrical unit of 14 cm diameter, b CFD-DEM simulations in an 8 × 8 cm
rectangular unit. Gas superficial velocity U 0 /U mf = 0.6 + 1.4 [1 + sin(2π12t)] and U 0 /U mf = 0.6
+ 0.8 [1 + sin(2π20t)] for the top and bottom patterns, respectively. In the contours, from red to
blue colour, the solid volume fraction decreases. Adapted with permission from [39]
Moreover, the universality curve reported by de Martín et al. [30] is recreated
numerically using the CFD-DEM model in 2D with quantitative agreement. For
two different particle sizes, 128 and 238 μm, the simulated results exhibit the
reduced critical amplitude with increasing the dimensionless frequency, similar to
the experimental measurements, as shown in Fig. 1.15.
Fig. 1.15 CFD-DEM reproduction of the onset for pattern formation in 2D domains, for glass
beads of a 238 μm and b 128 μm diameter. Initial bed depth of 7 mm, bed width of 15 cm
23
Fig. 1.14 Gas-driven patterns of 238 μm glass beads in a 3D domain. Bed height 3 mm (~29 d s ).
a Experiments in a cylindrical unit of 14 cm diameter, b CFD-DEM simulations in an 8 × 8 cm
rectangular unit. Gas superficial velocity U 0 /U mf = 0.6 + 1.4 [1 + sin(2π12t)] and U 0 /U mf = 0.6
+ 0.8 [1 + sin(2π20t)] for the top and bottom patterns, respectively. In the contours, from red to
blue colour, the solid volume fraction decreases. Adapted with permission from [39]
Moreover, the universality curve reported by de Martín et al. [30] is recreated
numerically using the CFD-DEM model in 2D with quantitative agreement. For
two different particle sizes, 128 and 238 μm, the simulated results exhibit the
reduced critical amplitude with increasing the dimensionless frequency, similar to
the experimental measurements, as shown in Fig. 1.15.
Fig. 1.15 CFD-DEM reproduction of the onset for pattern formation in 2D domains, for glass
beads of a 238 μm and b 128 μm diameter. Initial bed depth of 7 mm, bed width of 15 cm