

22
1 Introduction
it collapses. This critical amplitude also depends strongly on the pulse frequency.
The critical amplitude dramatically decreases when approaching f /f n ~ 0.5, and
eventually reaches a plateau for f /f n ≥ 1. The trend indicates a parametric resonance
between the development of kinematic waves and bulk dynamics.
1.5.4 Modelling of Pattern Formation in Pulsed Layers
For pulsed granular layers, the presence of a second phase significantly complicates
flow pattern dynamics and, thus, modelling practices. The introduced gas fills interparticle voids and imposes drag force, which depends on the local dynamics of both
the gas and the solid phase. Therefore, one must account for the intimate coupling
of the two phases, which presents the numerical reproduction of gas-driven patterns
a remarkable challenge.
Nonetheless, both discrete and continuum frameworks are capable of convincingly
predicting the phase coupling and the formation of a gas-driven pattern in a thin layer
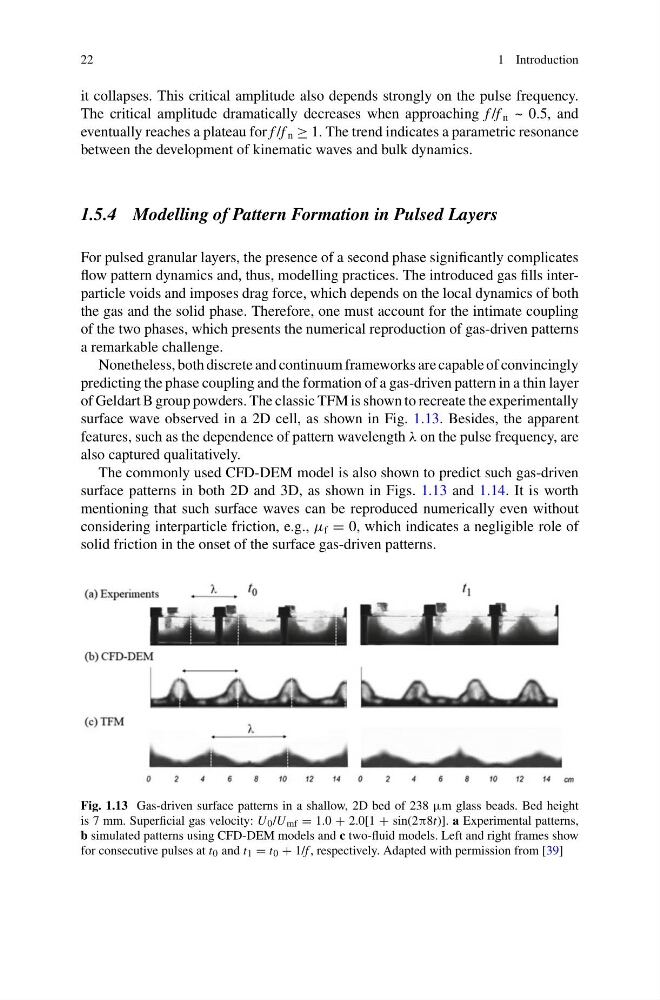
of Geldart B group powders. The classic TFM is shown to recreate the experimentally
surface wave observed in a 2D cell, as shown in Fig. 1.13. Besides, the apparent
features, such as the dependence of pattern wavelength λ on the pulse frequency, are
also captured qualitatively.
The commonly used CFD-DEM model is also shown to predict such gas-driven
surface patterns in both 2D and 3D, as shown in Figs. 1.13 and 1.14. It is worth
mentioning that such surface waves can be reproduced numerically even without
considering interparticle friction, e.g., μ f = 0, which indicates a negligible role of
solid friction in the onset of the surface gas-driven patterns.
Fig. 1.13 Gas-driven surface patterns in a shallow, 2D bed of 238 μm glass beads. Bed height
is 7 mm. Superficial gas velocity: U 0 /U mf = 1.0 + 2.0[1 + sin(2π8t)]. a Experimental patterns,
b simulated patterns using CFD-DEM models and c two-fluid models. Left and right frames show
for consecutive pulses at t 0 and t 1 = t 0 + 1/f , respectively. Adapted with permission from [39]
1 Introduction
it collapses. This critical amplitude also depends strongly on the pulse frequency.
The critical amplitude dramatically decreases when approaching f /f n ~ 0.5, and
eventually reaches a plateau for f /f n ≥ 1. The trend indicates a parametric resonance
between the development of kinematic waves and bulk dynamics.
1.5.4 Modelling of Pattern Formation in Pulsed Layers
For pulsed granular layers, the presence of a second phase significantly complicates
flow pattern dynamics and, thus, modelling practices. The introduced gas fills interparticle voids and imposes drag force, which depends on the local dynamics of both
the gas and the solid phase. Therefore, one must account for the intimate coupling
of the two phases, which presents the numerical reproduction of gas-driven patterns
a remarkable challenge.
Nonetheless, both discrete and continuum frameworks are capable of convincingly
predicting the phase coupling and the formation of a gas-driven pattern in a thin layer
of Geldart B group powders. The classic TFM is shown to recreate the experimentally
surface wave observed in a 2D cell, as shown in Fig. 1.13. Besides, the apparent
features, such as the dependence of pattern wavelength λ on the pulse frequency, are
also captured qualitatively.
The commonly used CFD-DEM model is also shown to predict such gas-driven
surface patterns in both 2D and 3D, as shown in Figs. 1.13 and 1.14. It is worth
mentioning that such surface waves can be reproduced numerically even without
considering interparticle friction, e.g., μ f = 0, which indicates a negligible role of
solid friction in the onset of the surface gas-driven patterns.
Fig. 1.13 Gas-driven surface patterns in a shallow, 2D bed of 238 μm glass beads. Bed height
is 7 mm. Superficial gas velocity: U 0 /U mf = 1.0 + 2.0[1 + sin(2π8t)]. a Experimental patterns,
b simulated patterns using CFD-DEM models and c two-fluid models. Left and right frames show
for consecutive pulses at t 0 and t 1 = t 0 + 1/f , respectively. Adapted with permission from [39]