

5.1 Introduction
117
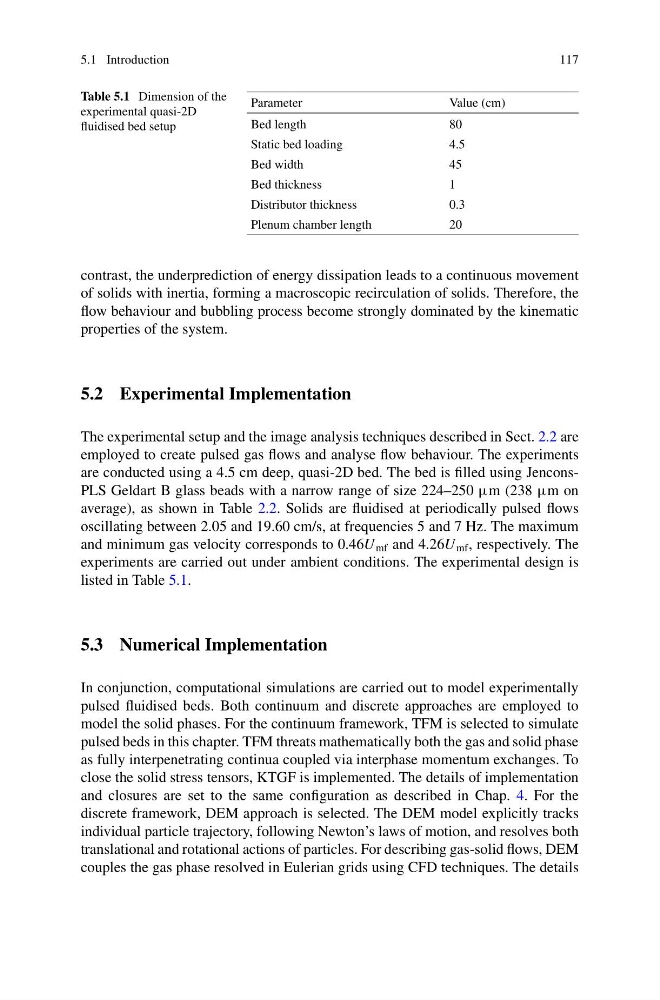
Table 5.1 Dimension of the
experimental quasi-2D
fluidised bed setup
Parameter
Value (cm)
Bed length
80
Static bed loading
4.5
Bed width
45
Bed thickness
1
Distributor thickness
0.3
Plenum chamber length
20
contrast, the underprediction of energy dissipation leads to a continuous movement
of solids with inertia, forming a macroscopic recirculation of solids. Therefore, the
flow behaviour and bubbling process become strongly dominated by the kinematic
properties of the system.
5.2 Experimental Implementation
The experimental setup and the image analysis techniques described in Sect. 2.2 are
employed to create pulsed gas flows and analyse flow behaviour. The experiments
are conducted using a 4.5 cm deep, quasi-2D bed. The bed is filled using JenconsPLS Geldart B glass beads with a narrow range of size 224–250 μm (238 μm on
average), as shown in Table 2.2. Solids are fluidised at periodically pulsed flows
oscillating between 2.05 and 19.60 cm/s, at frequencies 5 and 7 Hz. The maximum
and minimum gas velocity corresponds to 0.46U mf and 4.26U mf , respectively. The
experiments are carried out under ambient conditions. The experimental design is
listed in Table 5.1.
5.3 Numerical Implementation
In conjunction, computational simulations are carried out to model experimentally
pulsed fluidised beds. Both continuum and discrete approaches are employed to
model the solid phases. For the continuum framework, TFM is selected to simulate
pulsed beds in this chapter. TFM threats mathematically both the gas and solid phase
as fully interpenetrating continua coupled via interphase momentum exchanges. To
close the solid stress tensors, KTGF is implemented. The details of implementation
and closures are set to the same configuration as described in Chap. 4. For the
discrete framework, DEM approach is selected. The DEM model explicitly tracks
individual particle trajectory, following Newton’s laws of motion, and resolves both
translational and rotational actions of particles. For describing gas-solid flows, DEM
couples the gas phase resolved in Eulerian grids using CFD techniques. The details
117
Table 5.1 Dimension of the
experimental quasi-2D
fluidised bed setup
Parameter
Value (cm)
Bed length
80
Static bed loading
4.5
Bed width
45
Bed thickness
1
Distributor thickness
0.3
Plenum chamber length
20
contrast, the underprediction of energy dissipation leads to a continuous movement
of solids with inertia, forming a macroscopic recirculation of solids. Therefore, the
flow behaviour and bubbling process become strongly dominated by the kinematic
properties of the system.
5.2 Experimental Implementation
The experimental setup and the image analysis techniques described in Sect. 2.2 are
employed to create pulsed gas flows and analyse flow behaviour. The experiments
are conducted using a 4.5 cm deep, quasi-2D bed. The bed is filled using JenconsPLS Geldart B glass beads with a narrow range of size 224–250 μm (238 μm on
average), as shown in Table 2.2. Solids are fluidised at periodically pulsed flows
oscillating between 2.05 and 19.60 cm/s, at frequencies 5 and 7 Hz. The maximum
and minimum gas velocity corresponds to 0.46U mf and 4.26U mf , respectively. The
experiments are carried out under ambient conditions. The experimental design is
listed in Table 5.1.
5.3 Numerical Implementation
In conjunction, computational simulations are carried out to model experimentally
pulsed fluidised beds. Both continuum and discrete approaches are employed to
model the solid phases. For the continuum framework, TFM is selected to simulate
pulsed beds in this chapter. TFM threats mathematically both the gas and solid phase
as fully interpenetrating continua coupled via interphase momentum exchanges. To
close the solid stress tensors, KTGF is implemented. The details of implementation
and closures are set to the same configuration as described in Chap. 4. For the
discrete framework, DEM approach is selected. The DEM model explicitly tracks
individual particle trajectory, following Newton’s laws of motion, and resolves both
translational and rotational actions of particles. For describing gas-solid flows, DEM
couples the gas phase resolved in Eulerian grids using CFD techniques. The details