

1.4 XRD-Based Qualitative and Quantitative Analysis
Since the diffraction of X-rays was discovered in 1912, X-ray diffraction (XRD) has
become an effective and reliable technique for phase analysis [107]. XRD analysis
can provide both qualitative and quantitative information on the phases in a tested
sample [108, 109]. XRD is a reliable, precise, and reproducible method that can
identify the crystalline phases in solids (e.g., minerals and inorganic compounds)
and reveal structural details of their phases [81, 109, 110]. Consequently, XRD is
extensively used to characterize natural and industrial materials with the support of
detailed database information.
Every crystalline phase has a distinctive diffraction pattern. By analyzing the
peak positions (corresponding to d values) and peak intensities in the XRD pattern,
the crystalline phases in the sample can be identified. The phase analysis of XRD
data is based on Bragg’s law [108] (Eq. 7.3) and indicates the peaks of crystal lattice
scattering on the basis of two conditions: (i) the angle of the incident beam is equal to
the angle of the scattered beam, and (ii) the path length difference is equal to an
integer number of wavelengths.
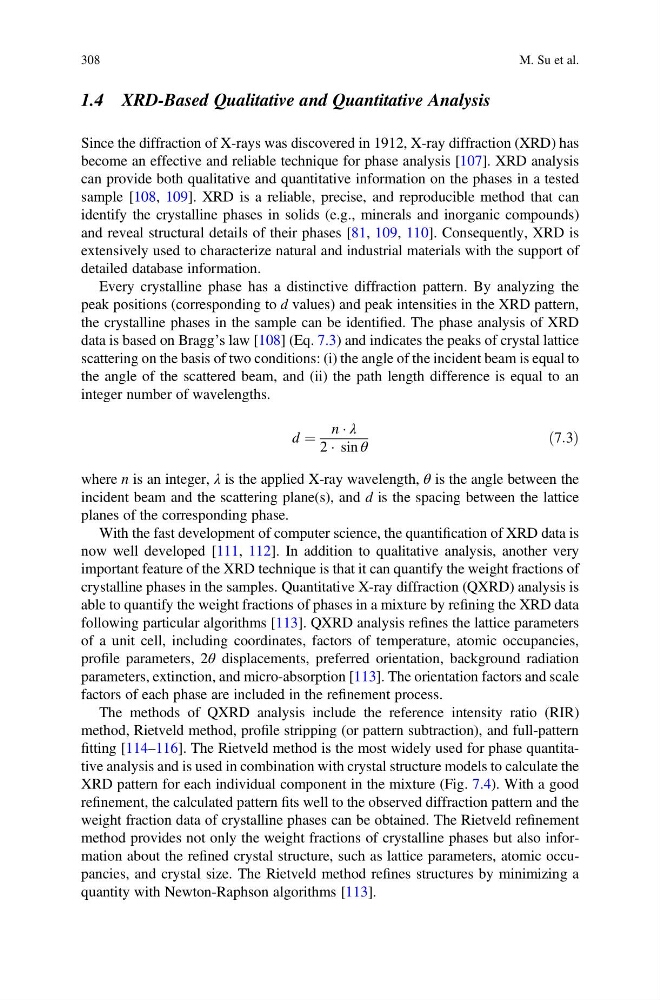
d ¼
n Á λ
2 Á sin θ
ð7:3Þ
where n is an integer, λ is the applied X-ray wavelength, θ is the angle between the
incident beam and the scattering plane(s), and d is the spacing between the lattice
planes of the corresponding phase.
With the fast development of computer science, the quantification of XRD data is
now well developed [111, 112]. In addition to qualitative analysis, another very
important feature of the XRD technique is that it can quantify the weight fractions of
crystalline phases in the samples. Quantitative X-ray diffraction (QXRD) analysis is
able to quantify the weight fractions of phases in a mixture by refining the XRD data
following particular algorithms [113]. QXRD analysis refines the lattice parameters
of a unit cell, including coordinates, factors of temperature, atomic occupancies,
profile parameters, 2θ displacements, preferred orientation, background radiation
parameters, extinction, and micro-absorption [113]. The orientation factors and scale
factors of each phase are included in the refinement process.
The methods of QXRD analysis include the reference intensity ratio (RIR)
method, Rietveld method, profile stripping (or pattern subtraction), and full-pattern
fitting [114–116]. The Rietveld method is the most widely used for phase quantitative analysis and is used in combination with crystal structure models to calculate the
XRD pattern for each individual component in the mixture (Fig. 7.4). With a good
refinement, the calculated pattern fits well to the observed diffraction pattern and the
weight fraction data of crystalline phases can be obtained. The Rietveld refinement
method provides not only the weight fractions of crystalline phases but also information about the refined crystal structure, such as lattice parameters, atomic occupancies, and crystal size. The Rietveld method refines structures by minimizing a
quantity with Newton-Raphson algorithms [113].
308
M. Su et al.
Since the diffraction of X-rays was discovered in 1912, X-ray diffraction (XRD) has
become an effective and reliable technique for phase analysis [107]. XRD analysis
can provide both qualitative and quantitative information on the phases in a tested
sample [108, 109]. XRD is a reliable, precise, and reproducible method that can
identify the crystalline phases in solids (e.g., minerals and inorganic compounds)
and reveal structural details of their phases [81, 109, 110]. Consequently, XRD is
extensively used to characterize natural and industrial materials with the support of
detailed database information.
Every crystalline phase has a distinctive diffraction pattern. By analyzing the
peak positions (corresponding to d values) and peak intensities in the XRD pattern,
the crystalline phases in the sample can be identified. The phase analysis of XRD
data is based on Bragg’s law [108] (Eq. 7.3) and indicates the peaks of crystal lattice
scattering on the basis of two conditions: (i) the angle of the incident beam is equal to
the angle of the scattered beam, and (ii) the path length difference is equal to an
integer number of wavelengths.
d ¼
n Á λ
2 Á sin θ
ð7:3Þ
where n is an integer, λ is the applied X-ray wavelength, θ is the angle between the
incident beam and the scattering plane(s), and d is the spacing between the lattice
planes of the corresponding phase.
With the fast development of computer science, the quantification of XRD data is
now well developed [111, 112]. In addition to qualitative analysis, another very
important feature of the XRD technique is that it can quantify the weight fractions of
crystalline phases in the samples. Quantitative X-ray diffraction (QXRD) analysis is
able to quantify the weight fractions of phases in a mixture by refining the XRD data
following particular algorithms [113]. QXRD analysis refines the lattice parameters
of a unit cell, including coordinates, factors of temperature, atomic occupancies,
profile parameters, 2θ displacements, preferred orientation, background radiation
parameters, extinction, and micro-absorption [113]. The orientation factors and scale
factors of each phase are included in the refinement process.
The methods of QXRD analysis include the reference intensity ratio (RIR)
method, Rietveld method, profile stripping (or pattern subtraction), and full-pattern
fitting [114–116]. The Rietveld method is the most widely used for phase quantitative analysis and is used in combination with crystal structure models to calculate the
XRD pattern for each individual component in the mixture (Fig. 7.4). With a good
refinement, the calculated pattern fits well to the observed diffraction pattern and the
weight fraction data of crystalline phases can be obtained. The Rietveld refinement
method provides not only the weight fractions of crystalline phases but also information about the refined crystal structure, such as lattice parameters, atomic occupancies, and crystal size. The Rietveld method refines structures by minimizing a
quantity with Newton-Raphson algorithms [113].
308
M. Su et al.