

same scale as the mass diagram. In order to determine the practicality of this rate, a
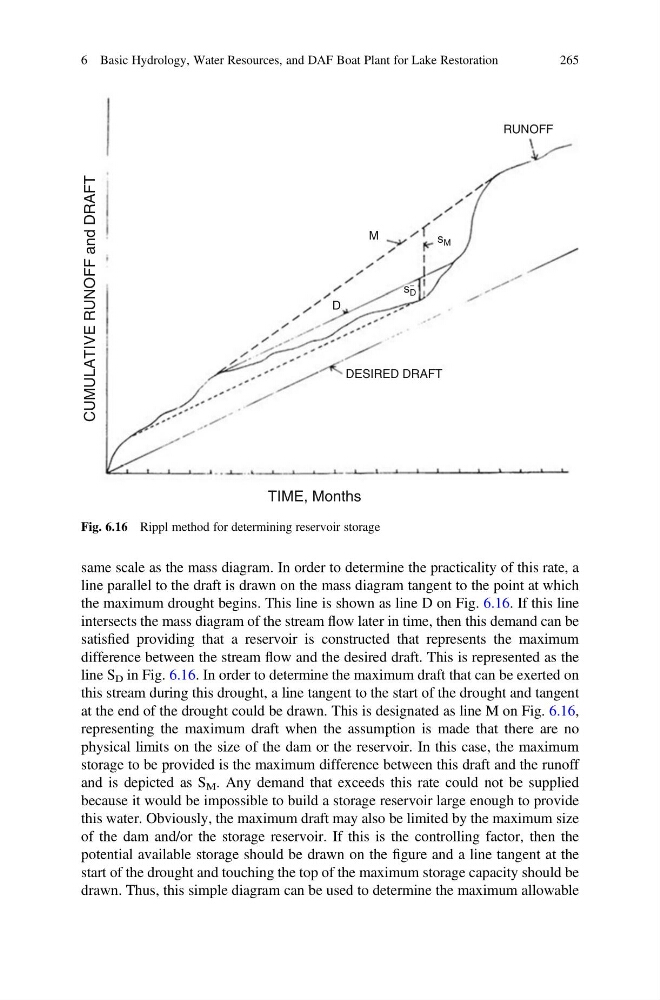
line parallel to the draft is drawn on the mass diagram tangent to the point at which
the maximum drought begins. This line is shown as line D on Fig. 6.16. If this line
intersects the mass diagram of the stream flow later in time, then this demand can be
satisfied providing that a reservoir is constructed that represents the maximum
difference between the stream flow and the desired draft. This is represented as the
line S D in Fig. 6.16. In order to determine the maximum draft that can be exerted on
this stream during this drought, a line tangent to the start of the drought and tangent
at the end of the drought could be drawn. This is designated as line M on Fig. 6.16,
representing the maximum draft when the assumption is made that there are no
physical limits on the size of the dam or the reservoir. In this case, the maximum
storage to be provided is the maximum difference between this draft and the runoff
and is depicted as S M . Any demand that exceeds this rate could not be supplied
because it would be impossible to build a storage reservoir large enough to provide
this water. Obviously, the maximum draft may also be limited by the maximum size
of the dam and/or the storage reservoir. If this is the controlling factor, then the
potential available storage should be drawn on the figure and a line tangent at the
start of the drought and touching the top of the maximum storage capacity should be
drawn. Thus, this simple diagram can be used to determine the maximum allowable
CUMULATIVE RUNOFF and DRAFT
TIME, Months
DESIRED DRAFT
RUNOFF
M
D
s M
s D
–
Fig. 6.16 Rippl method for determining reservoir storage
6 Basic Hydrology, Water Resources, and DAF Boat Plant for Lake Restoration
265
line parallel to the draft is drawn on the mass diagram tangent to the point at which
the maximum drought begins. This line is shown as line D on Fig. 6.16. If this line
intersects the mass diagram of the stream flow later in time, then this demand can be
satisfied providing that a reservoir is constructed that represents the maximum
difference between the stream flow and the desired draft. This is represented as the
line S D in Fig. 6.16. In order to determine the maximum draft that can be exerted on
this stream during this drought, a line tangent to the start of the drought and tangent
at the end of the drought could be drawn. This is designated as line M on Fig. 6.16,
representing the maximum draft when the assumption is made that there are no
physical limits on the size of the dam or the reservoir. In this case, the maximum
storage to be provided is the maximum difference between this draft and the runoff
and is depicted as S M . Any demand that exceeds this rate could not be supplied
because it would be impossible to build a storage reservoir large enough to provide
this water. Obviously, the maximum draft may also be limited by the maximum size
of the dam and/or the storage reservoir. If this is the controlling factor, then the
potential available storage should be drawn on the figure and a line tangent at the
start of the drought and touching the top of the maximum storage capacity should be
drawn. Thus, this simple diagram can be used to determine the maximum allowable
CUMULATIVE RUNOFF and DRAFT
TIME, Months
DESIRED DRAFT
RUNOFF
M
D
s M
s D
–
Fig. 6.16 Rippl method for determining reservoir storage
6 Basic Hydrology, Water Resources, and DAF Boat Plant for Lake Restoration
265