

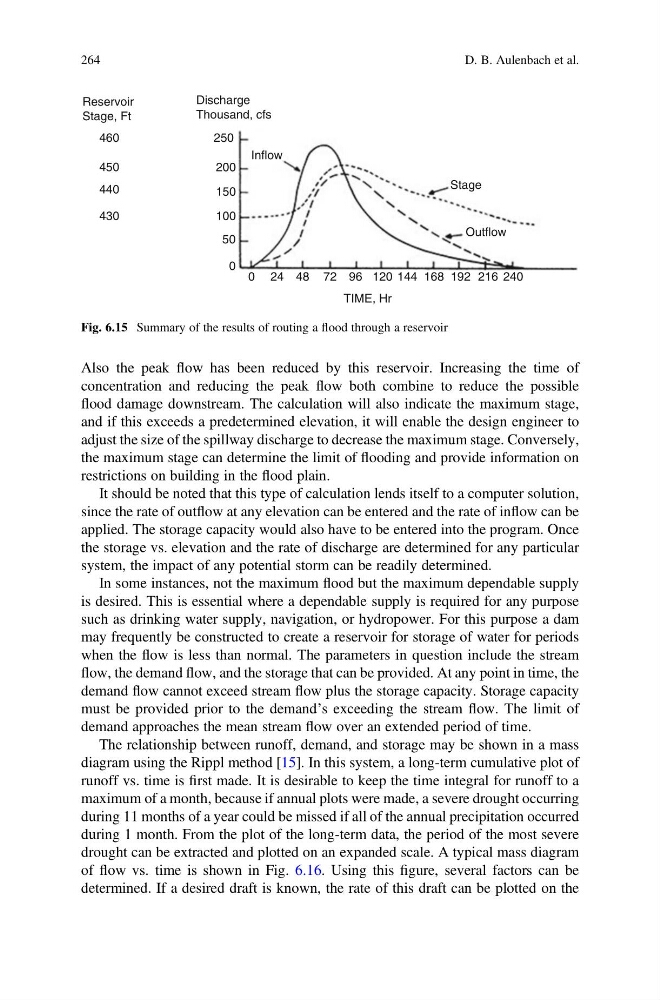
Also the peak flow has been reduced by this reservoir. Increasing the time of
concentration and reducing the peak flow both combine to reduce the possible
flood damage downstream. The calculation will also indicate the maximum stage,
and if this exceeds a predetermined elevation, it will enable the design engineer to
adjust the size of the spillway discharge to decrease the maximum stage. Conversely,
the maximum stage can determine the limit of flooding and provide information on
restrictions on building in the flood plain.
It should be noted that this type of calculation lends itself to a computer solution,
since the rate of outflow at any elevation can be entered and the rate of inflow can be
applied. The storage capacity would also have to be entered into the program. Once
the storage vs. elevation and the rate of discharge are determined for any particular
system, the impact of any potential storm can be readily determined.
In some instances, not the maximum flood but the maximum dependable supply
is desired. This is essential where a dependable supply is required for any purpose
such as drinking water supply, navigation, or hydropower. For this purpose a dam
may frequently be constructed to create a reservoir for storage of water for periods
when the flow is less than normal. The parameters in question include the stream
flow, the demand flow, and the storage that can be provided. At any point in time, the
demand flow cannot exceed stream flow plus the storage capacity. Storage capacity
must be provided prior to the demand’s exceeding the stream flow. The limit of
demand approaches the mean stream flow over an extended period of time.
The relationship between runoff, demand, and storage may be shown in a mass
diagram using the Rippl method [15]. In this system, a long-term cumulative plot of
runoff vs. time is first made. It is desirable to keep the time integral for runoff to a
maximum of a month, because if annual plots were made, a severe drought occurring
during 11 months of a year could be missed if all of the annual precipitation occurred
during 1 month. From the plot of the long-term data, the period of the most severe
drought can be extracted and plotted on an expanded scale. A typical mass diagram
of flow vs. time is shown in Fig. 6.16. Using this figure, several factors can be
determined. If a desired draft is known, the rate of this draft can be plotted on the
0
0
50
100
150
200
250
430
440
450
460
Reservoir
Stage, Ft
Discharge
Thousand, cfs
24 48 72 96 120
TIME, Hr
Outflow
Inflow
Stage
144 168 192 216 240
Fig. 6.15 Summary of the results of routing a flood through a reservoir
264
D. B. Aulenbach et al.
concentration and reducing the peak flow both combine to reduce the possible
flood damage downstream. The calculation will also indicate the maximum stage,
and if this exceeds a predetermined elevation, it will enable the design engineer to
adjust the size of the spillway discharge to decrease the maximum stage. Conversely,
the maximum stage can determine the limit of flooding and provide information on
restrictions on building in the flood plain.
It should be noted that this type of calculation lends itself to a computer solution,
since the rate of outflow at any elevation can be entered and the rate of inflow can be
applied. The storage capacity would also have to be entered into the program. Once
the storage vs. elevation and the rate of discharge are determined for any particular
system, the impact of any potential storm can be readily determined.
In some instances, not the maximum flood but the maximum dependable supply
is desired. This is essential where a dependable supply is required for any purpose
such as drinking water supply, navigation, or hydropower. For this purpose a dam
may frequently be constructed to create a reservoir for storage of water for periods
when the flow is less than normal. The parameters in question include the stream
flow, the demand flow, and the storage that can be provided. At any point in time, the
demand flow cannot exceed stream flow plus the storage capacity. Storage capacity
must be provided prior to the demand’s exceeding the stream flow. The limit of
demand approaches the mean stream flow over an extended period of time.
The relationship between runoff, demand, and storage may be shown in a mass
diagram using the Rippl method [15]. In this system, a long-term cumulative plot of
runoff vs. time is first made. It is desirable to keep the time integral for runoff to a
maximum of a month, because if annual plots were made, a severe drought occurring
during 11 months of a year could be missed if all of the annual precipitation occurred
during 1 month. From the plot of the long-term data, the period of the most severe
drought can be extracted and plotted on an expanded scale. A typical mass diagram
of flow vs. time is shown in Fig. 6.16. Using this figure, several factors can be
determined. If a desired draft is known, the rate of this draft can be plotted on the
0
0
50
100
150
200
250
430
440
450
460
Reservoir
Stage, Ft
Discharge
Thousand, cfs
24 48 72 96 120
TIME, Hr
Outflow
Inflow
Stage
144 168 192 216 240
Fig. 6.15 Summary of the results of routing a flood through a reservoir
264
D. B. Aulenbach et al.