

Thus by setting the scale of discharge (in cfs) in Fig. 6.12 to 1/2 that of the ac-ft,
we have effectively correlated the ac-ft half day and half of the mean discharge over
that time period. For a 6-h interval of inflow, which is used over the peak period, we
would have to divide the cfs by another factor of 2.
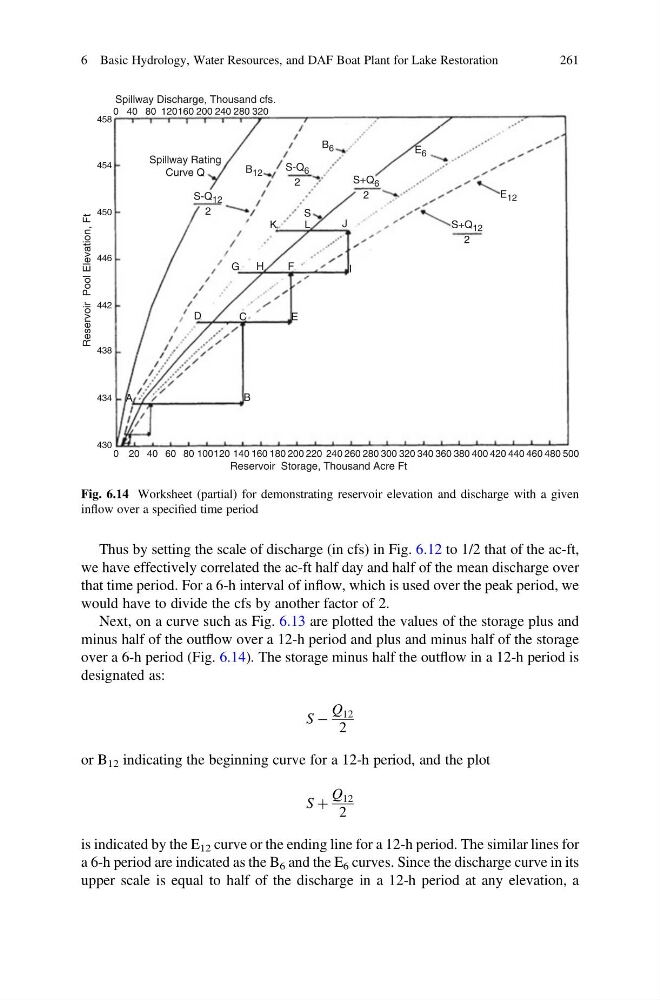
Next, on a curve such as Fig. 6.13 are plotted the values of the storage plus and
minus half of the outflow over a 12-h period and plus and minus half of the storage
over a 6-h period (Fig. 6.14). The storage minus half the outflow in a 12-h period is
designated as:
S À
Q 12
2
or B 12 indicating the beginning curve for a 12-h period, and the plot
S þ
Q 12
2
is indicated by the E 12 curve or the ending line for a 12-h period. The similar lines for
a 6-h period are indicated as the B 6 and the E 6 curves. Since the discharge curve in its
upper scale is equal to half of the discharge in a 12-h period at any elevation, a
0 20 40 60 80 100120 140 160 180 200 220
Reservoir Storage, Thousand Acre Ft
240 260 280 300 320 340 360 380 400 420 440 460 480 500
430
434
438
442
446
450
454
458
Reservoir Pool Elevation, Ft
Spillway Discharge, Thousand cfs.
0 40 80 120160 200 240 280 320
Spillway Rating
Curve Q
S-Q 12
2
S
L
K
G
H
F
I
J
E
C
B
A
D
S-Q 6
2
S+Q 6
2
S+Q 12
2
B 12
B 6
E 6
E 12
Fig. 6.14 Worksheet (partial) for demonstrating reservoir elevation and discharge with a given
inflow over a specified time period
6 Basic Hydrology, Water Resources, and DAF Boat Plant for Lake Restoration
261
we have effectively correlated the ac-ft half day and half of the mean discharge over
that time period. For a 6-h interval of inflow, which is used over the peak period, we
would have to divide the cfs by another factor of 2.
Next, on a curve such as Fig. 6.13 are plotted the values of the storage plus and
minus half of the outflow over a 12-h period and plus and minus half of the storage
over a 6-h period (Fig. 6.14). The storage minus half the outflow in a 12-h period is
designated as:
S À
Q 12
2
or B 12 indicating the beginning curve for a 12-h period, and the plot
S þ
Q 12
2
is indicated by the E 12 curve or the ending line for a 12-h period. The similar lines for
a 6-h period are indicated as the B 6 and the E 6 curves. Since the discharge curve in its
upper scale is equal to half of the discharge in a 12-h period at any elevation, a
0 20 40 60 80 100120 140 160 180 200 220
Reservoir Storage, Thousand Acre Ft
240 260 280 300 320 340 360 380 400 420 440 460 480 500
430
434
438
442
446
450
454
458
Reservoir Pool Elevation, Ft
Spillway Discharge, Thousand cfs.
0 40 80 120160 200 240 280 320
Spillway Rating
Curve Q
S-Q 12
2
S
L
K
G
H
F
I
J
E
C
B
A
D
S-Q 6
2
S+Q 6
2
S+Q 12
2
B 12
B 6
E 6
E 12
Fig. 6.14 Worksheet (partial) for demonstrating reservoir elevation and discharge with a given
inflow over a specified time period
6 Basic Hydrology, Water Resources, and DAF Boat Plant for Lake Restoration
261