

Obviously, metric units may be used with the appropriate conversion factors. For
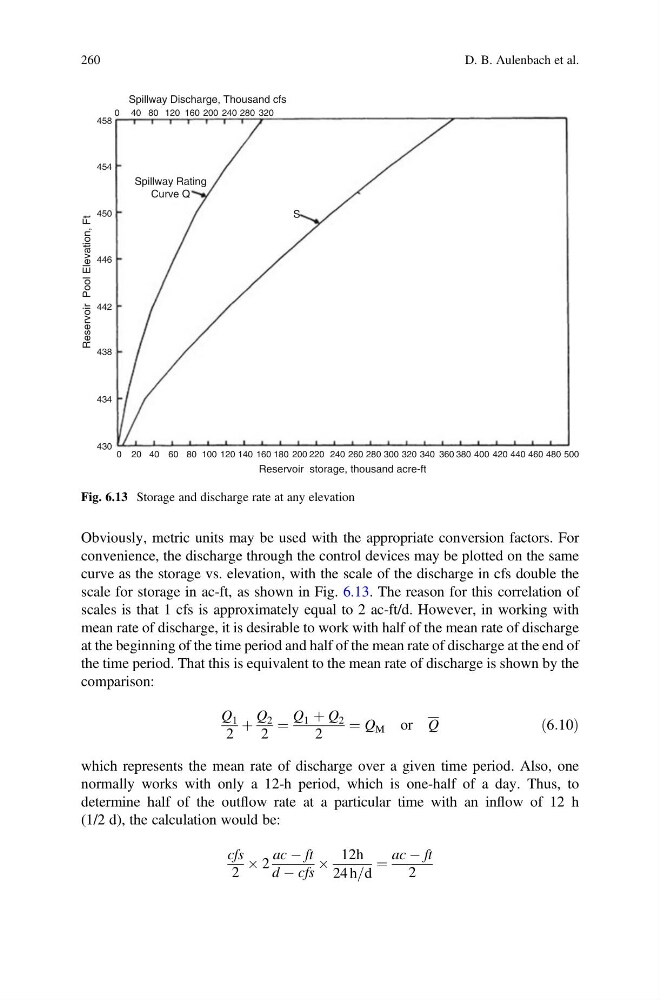
convenience, the discharge through the control devices may be plotted on the same
curve as the storage vs. elevation, with the scale of the discharge in cfs double the
scale for storage in ac-ft, as shown in Fig. 6.13. The reason for this correlation of
scales is that 1 cfs is approximately equal to 2 ac-ft/d. However, in working with
mean rate of discharge, it is desirable to work with half of the mean rate of discharge
at the beginning of the time period and half of the mean rate of discharge at the end of
the time period. That this is equivalent to the mean rate of discharge is shown by the
comparison:
Q 1
2
þ
Q 2
2
¼
Q 1 þ Q 2
2
¼ Q M or Q
ð6:10Þ
which represents the mean rate of discharge over a given time period. Also, one
normally works with only a 12-h period, which is one-half of a day. Thus, to
determine half of the outflow rate at a particular time with an inflow of 12 h
(1/2 d), the calculation would be:
cfs
2
 2
ac À ft
d À cfs
Â
12h
24 h=d
¼
ac À ft
2
0
430
434
438
442
446
450
S
Spillway Rating
Curve Q
Spillway Discharge, Thousand cfs
454
458
0 40 80 120 160 200 240 280 320
20 40 60 80 100 120 140 160 180 200 220
Reservoir storage, thousand acre-ft
Reservoir Pool Elevation, Ft
240 260 280 300 320 340 360 380 400 420 440 460 480 500
Fig. 6.13 Storage and discharge rate at any elevation
260
D. B. Aulenbach et al.
convenience, the discharge through the control devices may be plotted on the same
curve as the storage vs. elevation, with the scale of the discharge in cfs double the
scale for storage in ac-ft, as shown in Fig. 6.13. The reason for this correlation of
scales is that 1 cfs is approximately equal to 2 ac-ft/d. However, in working with
mean rate of discharge, it is desirable to work with half of the mean rate of discharge
at the beginning of the time period and half of the mean rate of discharge at the end of
the time period. That this is equivalent to the mean rate of discharge is shown by the
comparison:
Q 1
2
þ
Q 2
2
¼
Q 1 þ Q 2
2
¼ Q M or Q
ð6:10Þ
which represents the mean rate of discharge over a given time period. Also, one
normally works with only a 12-h period, which is one-half of a day. Thus, to
determine half of the outflow rate at a particular time with an inflow of 12 h
(1/2 d), the calculation would be:
cfs
2
 2
ac À ft
d À cfs
Â
12h
24 h=d
¼
ac À ft
2
0
430
434
438
442
446
450
S
Spillway Rating
Curve Q
Spillway Discharge, Thousand cfs
454
458
0 40 80 120 160 200 240 280 320
20 40 60 80 100 120 140 160 180 200 220
Reservoir storage, thousand acre-ft
Reservoir Pool Elevation, Ft
240 260 280 300 320 340 360 380 400 420 440 460 480 500
Fig. 6.13 Storage and discharge rate at any elevation
260
D. B. Aulenbach et al.