

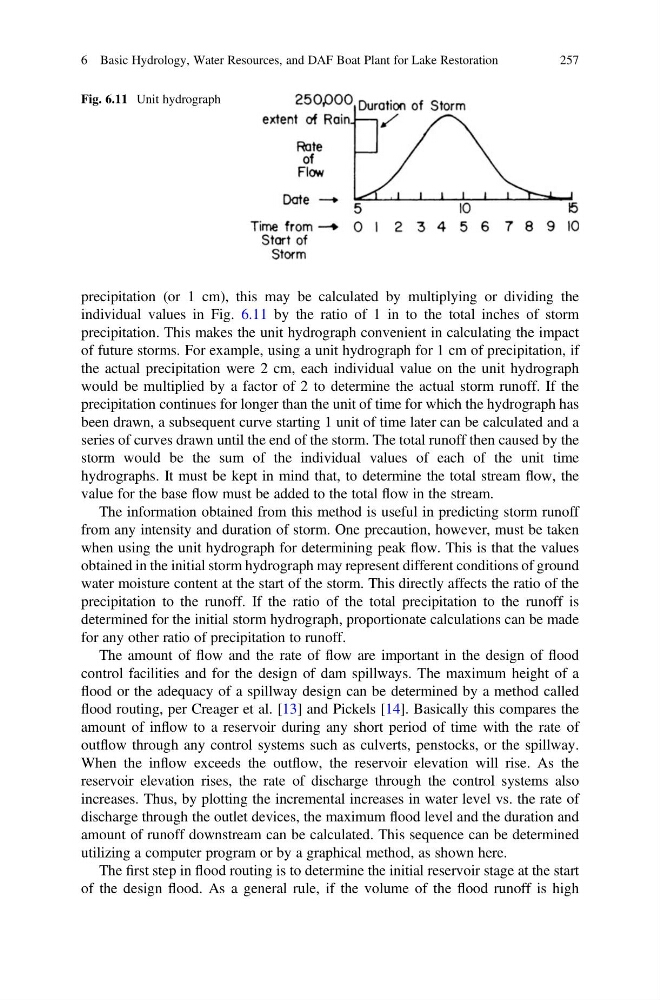
precipitation (or 1 cm), this may be calculated by multiplying or dividing the
individual values in Fig. 6.11 by the ratio of 1 in to the total inches of storm
precipitation. This makes the unit hydrograph convenient in calculating the impact
of future storms. For example, using a unit hydrograph for 1 cm of precipitation, if
the actual precipitation were 2 cm, each individual value on the unit hydrograph
would be multiplied by a factor of 2 to determine the actual storm runoff. If the
precipitation continues for longer than the unit of time for which the hydrograph has
been drawn, a subsequent curve starting 1 unit of time later can be calculated and a
series of curves drawn until the end of the storm. The total runoff then caused by the
storm would be the sum of the individual values of each of the unit time
hydrographs. It must be kept in mind that, to determine the total stream flow, the
value for the base flow must be added to the total flow in the stream.
The information obtained from this method is useful in predicting storm runoff
from any intensity and duration of storm. One precaution, however, must be taken
when using the unit hydrograph for determining peak flow. This is that the values
obtained in the initial storm hydrograph may represent different conditions of ground
water moisture content at the start of the storm. This directly affects the ratio of the
precipitation to the runoff. If the ratio of the total precipitation to the runoff is
determined for the initial storm hydrograph, proportionate calculations can be made
for any other ratio of precipitation to runoff.
The amount of flow and the rate of flow are important in the design of flood
control facilities and for the design of dam spillways. The maximum height of a
flood or the adequacy of a spillway design can be determined by a method called
flood routing, per Creager et al. [13] and Pickels [14]. Basically this compares the
amount of inflow to a reservoir during any short period of time with the rate of
outflow through any control systems such as culverts, penstocks, or the spillway.
When the inflow exceeds the outflow, the reservoir elevation will rise. As the
reservoir elevation rises, the rate of discharge through the control systems also
increases. Thus, by plotting the incremental increases in water level vs. the rate of
discharge through the outlet devices, the maximum flood level and the duration and
amount of runoff downstream can be calculated. This sequence can be determined
utilizing a computer program or by a graphical method, as shown here.
The first step in flood routing is to determine the initial reservoir stage at the start
of the design flood. As a general rule, if the volume of the flood runoff is high
Fig. 6.11 Unit hydrograph
6 Basic Hydrology, Water Resources, and DAF Boat Plant for Lake Restoration
257
individual values in Fig. 6.11 by the ratio of 1 in to the total inches of storm
precipitation. This makes the unit hydrograph convenient in calculating the impact
of future storms. For example, using a unit hydrograph for 1 cm of precipitation, if
the actual precipitation were 2 cm, each individual value on the unit hydrograph
would be multiplied by a factor of 2 to determine the actual storm runoff. If the
precipitation continues for longer than the unit of time for which the hydrograph has
been drawn, a subsequent curve starting 1 unit of time later can be calculated and a
series of curves drawn until the end of the storm. The total runoff then caused by the
storm would be the sum of the individual values of each of the unit time
hydrographs. It must be kept in mind that, to determine the total stream flow, the
value for the base flow must be added to the total flow in the stream.
The information obtained from this method is useful in predicting storm runoff
from any intensity and duration of storm. One precaution, however, must be taken
when using the unit hydrograph for determining peak flow. This is that the values
obtained in the initial storm hydrograph may represent different conditions of ground
water moisture content at the start of the storm. This directly affects the ratio of the
precipitation to the runoff. If the ratio of the total precipitation to the runoff is
determined for the initial storm hydrograph, proportionate calculations can be made
for any other ratio of precipitation to runoff.
The amount of flow and the rate of flow are important in the design of flood
control facilities and for the design of dam spillways. The maximum height of a
flood or the adequacy of a spillway design can be determined by a method called
flood routing, per Creager et al. [13] and Pickels [14]. Basically this compares the
amount of inflow to a reservoir during any short period of time with the rate of
outflow through any control systems such as culverts, penstocks, or the spillway.
When the inflow exceeds the outflow, the reservoir elevation will rise. As the
reservoir elevation rises, the rate of discharge through the control systems also
increases. Thus, by plotting the incremental increases in water level vs. the rate of
discharge through the outlet devices, the maximum flood level and the duration and
amount of runoff downstream can be calculated. This sequence can be determined
utilizing a computer program or by a graphical method, as shown here.
The first step in flood routing is to determine the initial reservoir stage at the start
of the design flood. As a general rule, if the volume of the flood runoff is high
Fig. 6.11 Unit hydrograph
6 Basic Hydrology, Water Resources, and DAF Boat Plant for Lake Restoration
257