

whereas in large basins it may be in the order of 1 d. Frequently a 6-h duration of
precipitation is a convenient value for calculating the unit hydrograph for a river.
In the use of the concept of the unit hydrograph, the first process is to determine
stream flow as the result of an individual storm event. When possible, the beginning
time for this sequence should be long enough after a significant pre-occurring
precipitation so that the stream will reach its base flow or relatively constant flow.
The onset of precipitation and its total amount are recorded and correlated with the
stream flow resulting from this storm. When possible, the flow data are continued
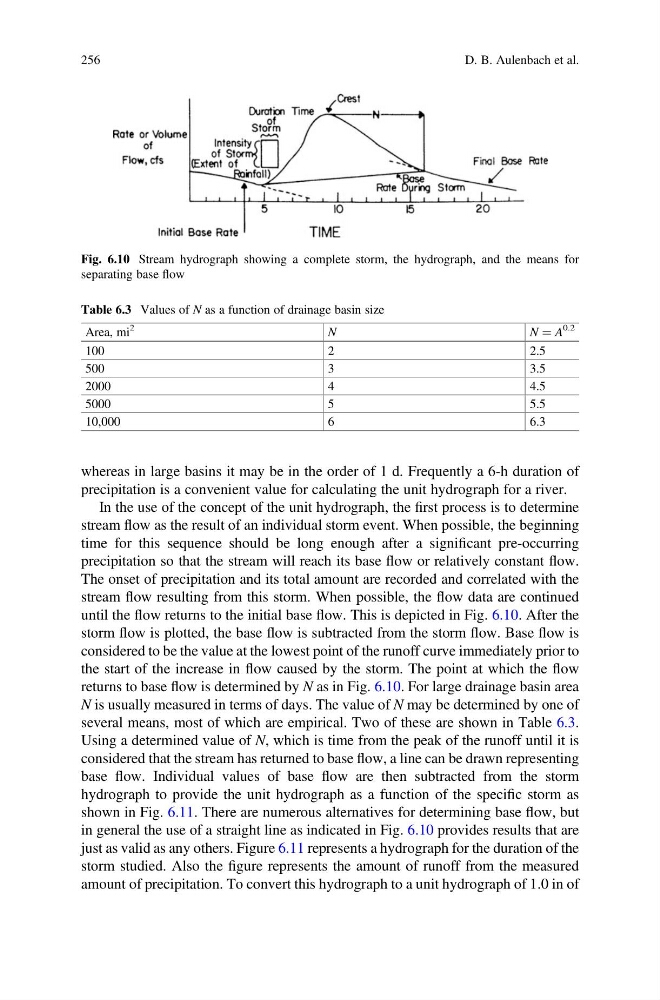
until the flow returns to the initial base flow. This is depicted in Fig. 6.10. After the
storm flow is plotted, the base flow is subtracted from the storm flow. Base flow is
considered to be the value at the lowest point of the runoff curve immediately prior to
the start of the increase in flow caused by the storm. The point at which the flow
returns to base flow is determined by N as in Fig. 6.10. For large drainage basin area
N is usually measured in terms of days. The value of N may be determined by one of
several means, most of which are empirical. Two of these are shown in Table 6.3.
Using a determined value of N, which is time from the peak of the runoff until it is
considered that the stream has returned to base flow, a line can be drawn representing
base flow. Individual values of base flow are then subtracted from the storm
hydrograph to provide the unit hydrograph as a function of the specific storm as
shown in Fig. 6.11. There are numerous alternatives for determining base flow, but
in general the use of a straight line as indicated in Fig. 6.10 provides results that are
just as valid as any others. Figure 6.11 represents a hydrograph for the duration of the
storm studied. Also the figure represents the amount of runoff from the measured
amount of precipitation. To convert this hydrograph to a unit hydrograph of 1.0 in of
Fig. 6.10 Stream hydrograph showing a complete storm, the hydrograph, and the means for
separating base flow
Table 6.3 Values of N as a function of drainage basin size
Area, mi
2
N
N ¼ A
0.2
100
2
2.5
500
3
3.5
2000
4
4.5
5000
5
5.5
10,000
6
6.3
256
D. B. Aulenbach et al.
precipitation is a convenient value for calculating the unit hydrograph for a river.
In the use of the concept of the unit hydrograph, the first process is to determine
stream flow as the result of an individual storm event. When possible, the beginning
time for this sequence should be long enough after a significant pre-occurring
precipitation so that the stream will reach its base flow or relatively constant flow.
The onset of precipitation and its total amount are recorded and correlated with the
stream flow resulting from this storm. When possible, the flow data are continued
until the flow returns to the initial base flow. This is depicted in Fig. 6.10. After the
storm flow is plotted, the base flow is subtracted from the storm flow. Base flow is
considered to be the value at the lowest point of the runoff curve immediately prior to
the start of the increase in flow caused by the storm. The point at which the flow
returns to base flow is determined by N as in Fig. 6.10. For large drainage basin area
N is usually measured in terms of days. The value of N may be determined by one of
several means, most of which are empirical. Two of these are shown in Table 6.3.
Using a determined value of N, which is time from the peak of the runoff until it is
considered that the stream has returned to base flow, a line can be drawn representing
base flow. Individual values of base flow are then subtracted from the storm
hydrograph to provide the unit hydrograph as a function of the specific storm as
shown in Fig. 6.11. There are numerous alternatives for determining base flow, but
in general the use of a straight line as indicated in Fig. 6.10 provides results that are
just as valid as any others. Figure 6.11 represents a hydrograph for the duration of the
storm studied. Also the figure represents the amount of runoff from the measured
amount of precipitation. To convert this hydrograph to a unit hydrograph of 1.0 in of
Fig. 6.10 Stream hydrograph showing a complete storm, the hydrograph, and the means for
separating base flow
Table 6.3 Values of N as a function of drainage basin size
Area, mi
2
N
N ¼ A
0.2
100
2
2.5
500
3
3.5
2000
4
4.5
5000
5
5.5
10,000
6
6.3
256
D. B. Aulenbach et al.