

3 Collective Magnetic Behaviour
73
0
50
100
150
200
250
T (K)
0
0.5
1
1.5
2
2.5
3
3.5
4
4.5
5
M/H (SI)
120 140 160 180 200
0
0.1
0.2
(arb. units)
(arb. units)
T f
ZFC
FC
RCP8
120 130 140 150 160 170 180 190 200
T (K)
0
0.5
1
1.5
2
2.5
3
3.5
4
(arb. units)
10 -4
-2.4
-2.2
-2
-1.8
-1.6
-10
-8
-6
-4
-2
0
2
T f
RCP8
T g = 140 K
0 = 6 x 10 -12 s
z = 11
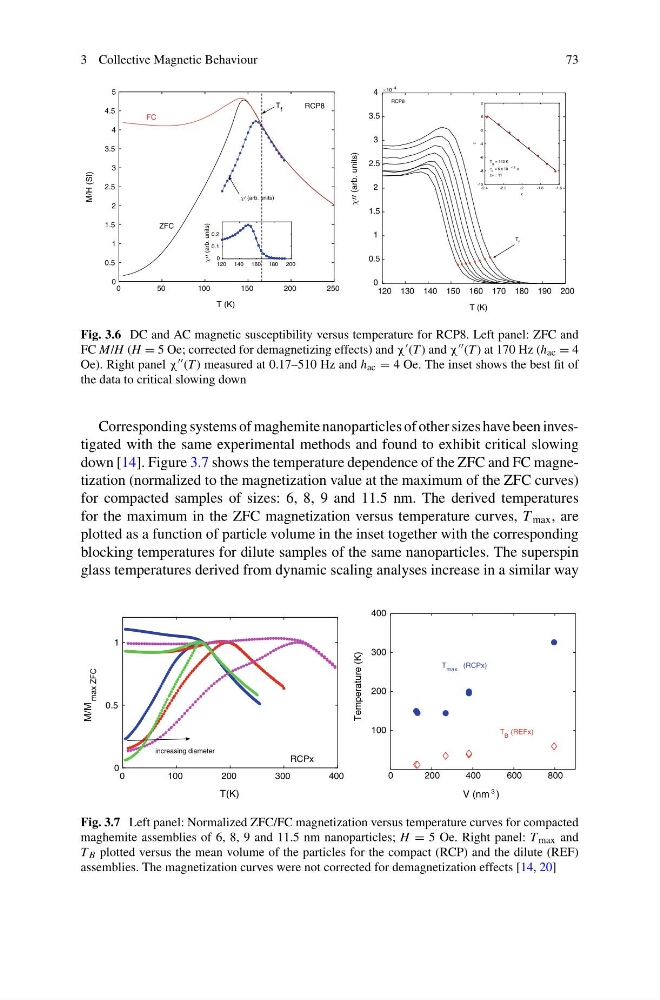
Fig. 3.6 DC and AC magnetic susceptibility versus temperature for RCP8. Left panel: ZFC and
FC M/H (H = 5 Oe; corrected for demagnetizing effects) and χ (T ) and χ (T ) at 170 Hz (h ac = 4
Oe). Right panel χ (T ) measured at 0.17–510 Hz and h ac = 4 Oe. The inset shows the best fit of
the data to critical slowing down
Corresponding systems of maghemite nanoparticles of other sizes have been investigated with the same experimental methods and found to exhibit critical slowing
down [14]. Figure 3.7 shows the temperature dependence of the ZFC and FC magnetization (normalized to the magnetization value at the maximum of the ZFC curves)
for compacted samples of sizes: 6, 8, 9 and 11.5 nm. The derived temperatures
for the maximum in the ZFC magnetization versus temperature curves, T max , are
plotted as a function of particle volume in the inset together with the corresponding
blocking temperatures for dilute samples of the same nanoparticles. The superspin
glass temperatures derived from dynamic scaling analyses increase in a similar way
0
100
200
300
400
T(K)
0
0.5
1
M/M
max ZFC
RCPx
increasing diameter
0
200
400
600
800
V (nm
3 )
100
200
300
400
Temperature (K)
T max (RCPx)
T B (REFx)
Fig. 3.7 Left panel: Normalized ZFC/FC magnetization versus temperature curves for compacted
maghemite assemblies of 6, 8, 9 and 11.5 nm nanoparticles; H = 5 Oe. Right panel: T max and
T B plotted versus the mean volume of the particles for the compact (RCP) and the dilute (REF)
assemblies. The magnetization curves were not corrected for demagnetization effects [14, 20]
73
0
50
100
150
200
250
T (K)
0
0.5
1
1.5
2
2.5
3
3.5
4
4.5
5
M/H (SI)
120 140 160 180 200
0
0.1
0.2
(arb. units)
(arb. units)
T f
ZFC
FC
RCP8
120 130 140 150 160 170 180 190 200
T (K)
0
0.5
1
1.5
2
2.5
3
3.5
4
(arb. units)
10 -4
-2.4
-2.2
-2
-1.8
-1.6
-10
-8
-6
-4
-2
0
2
T f
RCP8
T g = 140 K
0 = 6 x 10 -12 s
z = 11
Fig. 3.6 DC and AC magnetic susceptibility versus temperature for RCP8. Left panel: ZFC and
FC M/H (H = 5 Oe; corrected for demagnetizing effects) and χ (T ) and χ (T ) at 170 Hz (h ac = 4
Oe). Right panel χ (T ) measured at 0.17–510 Hz and h ac = 4 Oe. The inset shows the best fit of
the data to critical slowing down
Corresponding systems of maghemite nanoparticles of other sizes have been investigated with the same experimental methods and found to exhibit critical slowing
down [14]. Figure 3.7 shows the temperature dependence of the ZFC and FC magnetization (normalized to the magnetization value at the maximum of the ZFC curves)
for compacted samples of sizes: 6, 8, 9 and 11.5 nm. The derived temperatures
for the maximum in the ZFC magnetization versus temperature curves, T max , are
plotted as a function of particle volume in the inset together with the corresponding
blocking temperatures for dilute samples of the same nanoparticles. The superspin
glass temperatures derived from dynamic scaling analyses increase in a similar way
0
100
200
300
400
T(K)
0
0.5
1
M/M
max ZFC
RCPx
increasing diameter
0
200
400
600
800
V (nm
3 )
100
200
300
400
Temperature (K)
T max (RCPx)
T B (REFx)
Fig. 3.7 Left panel: Normalized ZFC/FC magnetization versus temperature curves for compacted
maghemite assemblies of 6, 8, 9 and 11.5 nm nanoparticles; H = 5 Oe. Right panel: T max and
T B plotted versus the mean volume of the particles for the compact (RCP) and the dilute (REF)
assemblies. The magnetization curves were not corrected for demagnetization effects [14, 20]