

72
R. Mathieu and P. Nordblad
0
10
20
30
40
(arb. units)
0
2 0
4 0
6 0
0
1
2
3
4
5
T (K)
(arb. units)
0
2 0
4 0
6 0
T (K)
0
2 0
4 0
6 0
T (K)
concentration
0.06 %
5 %
17 %
Fe-C
f = 1 000 Hz
f = 125 Hz
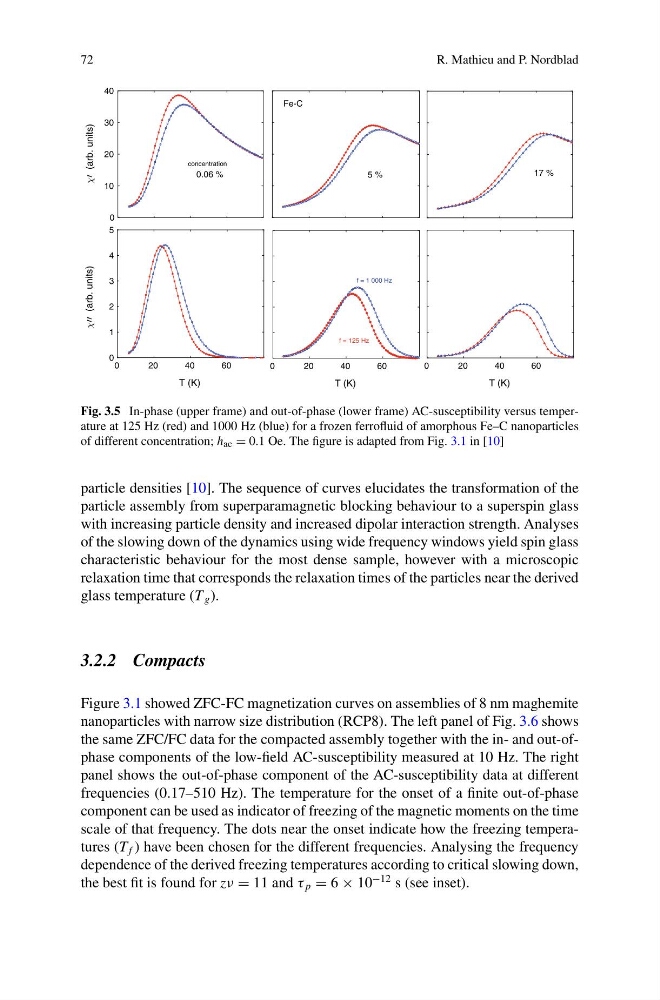
Fig. 3.5 In-phase (upper frame) and out-of-phase (lower frame) AC-susceptibility versus temperature at 125 Hz (red) and 1000 Hz (blue) for a frozen ferrofluid of amorphous Fe–C nanoparticles
of different concentration; h ac = 0.1 Oe. The figure is adapted from Fig. 3.1 in [10]
particle densities [10]. The sequence of curves elucidates the transformation of the
particle assembly from superparamagnetic blocking behaviour to a superspin glass
with increasing particle density and increased dipolar interaction strength. Analyses
of the slowing down of the dynamics using wide frequency windows yield spin glass
characteristic behaviour for the most dense sample, however with a microscopic
relaxation time that corresponds the relaxation times of the particles near the derived
glass temperature (T g ).
3.2.2 Compacts
Figure 3.1 showed ZFC-FC magnetization curves on assemblies of 8 nm maghemite
nanoparticles with narrow size distribution (RCP8). The left panel of Fig. 3.6 shows
the same ZFC/FC data for the compacted assembly together with the in- and out-ofphase components of the low-field AC-susceptibility measured at 10 Hz. The right
panel shows the out-of-phase component of the AC-susceptibility data at different
frequencies (0.17–510 Hz). The temperature for the onset of a finite out-of-phase
component can be used as indicator of freezing of the magnetic moments on the time
scale of that frequency. The dots near the onset indicate how the freezing temperatures (T f ) have been chosen for the different frequencies. Analysing the frequency
dependence of the derived freezing temperatures according to critical slowing down,
the best fit is found for zν = 11 and τ p = 6 × 10
−12 s (see inset).
R. Mathieu and P. Nordblad
0
10
20
30
40
(arb. units)
0
2 0
4 0
6 0
0
1
2
3
4
5
T (K)
(arb. units)
0
2 0
4 0
6 0
T (K)
0
2 0
4 0
6 0
T (K)
concentration
0.06 %
5 %
17 %
Fe-C
f = 1 000 Hz
f = 125 Hz
Fig. 3.5 In-phase (upper frame) and out-of-phase (lower frame) AC-susceptibility versus temperature at 125 Hz (red) and 1000 Hz (blue) for a frozen ferrofluid of amorphous Fe–C nanoparticles
of different concentration; h ac = 0.1 Oe. The figure is adapted from Fig. 3.1 in [10]
particle densities [10]. The sequence of curves elucidates the transformation of the
particle assembly from superparamagnetic blocking behaviour to a superspin glass
with increasing particle density and increased dipolar interaction strength. Analyses
of the slowing down of the dynamics using wide frequency windows yield spin glass
characteristic behaviour for the most dense sample, however with a microscopic
relaxation time that corresponds the relaxation times of the particles near the derived
glass temperature (T g ).
3.2.2 Compacts
Figure 3.1 showed ZFC-FC magnetization curves on assemblies of 8 nm maghemite
nanoparticles with narrow size distribution (RCP8). The left panel of Fig. 3.6 shows
the same ZFC/FC data for the compacted assembly together with the in- and out-ofphase components of the low-field AC-susceptibility measured at 10 Hz. The right
panel shows the out-of-phase component of the AC-susceptibility data at different
frequencies (0.17–510 Hz). The temperature for the onset of a finite out-of-phase
component can be used as indicator of freezing of the magnetic moments on the time
scale of that frequency. The dots near the onset indicate how the freezing temperatures (T f ) have been chosen for the different frequencies. Analysing the frequency
dependence of the derived freezing temperatures according to critical slowing down,
the best fit is found for zν = 11 and τ p = 6 × 10
−12 s (see inset).