

2 Interparticle Interactions: Theory and Mesoscopic Modeling
55
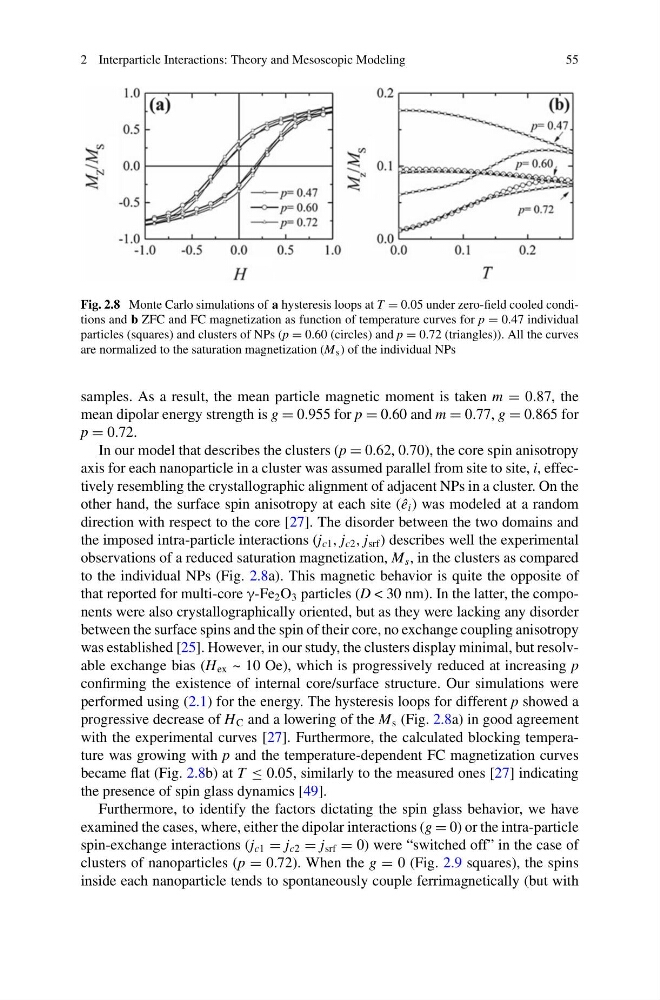
Fig. 2.8 Monte Carlo simulations of a hysteresis loops at T = 0.05 under zero-field cooled conditions and b ZFC and FC magnetization as function of temperature curves for p = 0.47 individual
particles (squares) and clusters of NPs (p = 0.60 (circles) and p = 0.72 (triangles)). All the curves
are normalized to the saturation magnetization (M s ) of the individual NPs
samples. As a result, the mean particle magnetic moment is taken m = 0.87, the
mean dipolar energy strength is g = 0.955 for p = 0.60 and m = 0.77, g = 0.865 for
p = 0.72.
In our model that describes the clusters (p = 0.62, 0.70), the core spin anisotropy
axis for each nanoparticle in a cluster was assumed parallel from site to site, i, effectively resembling the crystallographic alignment of adjacent NPs in a cluster. On the
other hand, the surface spin anisotropy at each site (ê i ) was modeled at a random
direction with respect to the core [27]. The disorder between the two domains and
the imposed intra-particle interactions (j c1 , j c2 , j srf ) describes well the experimental
observations of a reduced saturation magnetization, M s , in the clusters as compared
to the individual NPs (Fig. 2.8a). This magnetic behavior is quite the opposite of
that reported for multi-core γ-Fe 2 O 3 particles (D < 30 nm). In the latter, the components were also crystallographically oriented, but as they were lacking any disorder
between the surface spins and the spin of their core, no exchange coupling anisotropy
was established [25]. However, in our study, the clusters display minimal, but resolvable exchange bias (H ex ~ 10 Oe), which is progressively reduced at increasing p
confirming the existence of internal core/surface structure. Our simulations were
performed using (2.1) for the energy. The hysteresis loops for different p showed a
progressive decrease of H C and a lowering of the M s (Fig. 2.8a) in good agreement
with the experimental curves [27]. Furthermore, the calculated blocking temperature was growing with p and the temperature-dependent FC magnetization curves
became flat (Fig. 2.8b) at T ≤ 0.05, similarly to the measured ones [27] indicating
the presence of spin glass dynamics [49].
Furthermore, to identify the factors dictating the spin glass behavior, we have
examined the cases, where, either the dipolar interactions (g = 0) or the intra-particle
spin-exchange interactions (j c1 = j c2 = j srf = 0) were “switched off” in the case of
clusters of nanoparticles (p = 0.72). When the g = 0 (Fig. 2.9 squares), the spins
inside each nanoparticle tends to spontaneously couple ferrimagnetically (but with
55
Fig. 2.8 Monte Carlo simulations of a hysteresis loops at T = 0.05 under zero-field cooled conditions and b ZFC and FC magnetization as function of temperature curves for p = 0.47 individual
particles (squares) and clusters of NPs (p = 0.60 (circles) and p = 0.72 (triangles)). All the curves
are normalized to the saturation magnetization (M s ) of the individual NPs
samples. As a result, the mean particle magnetic moment is taken m = 0.87, the
mean dipolar energy strength is g = 0.955 for p = 0.60 and m = 0.77, g = 0.865 for
p = 0.72.
In our model that describes the clusters (p = 0.62, 0.70), the core spin anisotropy
axis for each nanoparticle in a cluster was assumed parallel from site to site, i, effectively resembling the crystallographic alignment of adjacent NPs in a cluster. On the
other hand, the surface spin anisotropy at each site (ê i ) was modeled at a random
direction with respect to the core [27]. The disorder between the two domains and
the imposed intra-particle interactions (j c1 , j c2 , j srf ) describes well the experimental
observations of a reduced saturation magnetization, M s , in the clusters as compared
to the individual NPs (Fig. 2.8a). This magnetic behavior is quite the opposite of
that reported for multi-core γ-Fe 2 O 3 particles (D < 30 nm). In the latter, the components were also crystallographically oriented, but as they were lacking any disorder
between the surface spins and the spin of their core, no exchange coupling anisotropy
was established [25]. However, in our study, the clusters display minimal, but resolvable exchange bias (H ex ~ 10 Oe), which is progressively reduced at increasing p
confirming the existence of internal core/surface structure. Our simulations were
performed using (2.1) for the energy. The hysteresis loops for different p showed a
progressive decrease of H C and a lowering of the M s (Fig. 2.8a) in good agreement
with the experimental curves [27]. Furthermore, the calculated blocking temperature was growing with p and the temperature-dependent FC magnetization curves
became flat (Fig. 2.8b) at T ≤ 0.05, similarly to the measured ones [27] indicating
the presence of spin glass dynamics [49].
Furthermore, to identify the factors dictating the spin glass behavior, we have
examined the cases, where, either the dipolar interactions (g = 0) or the intra-particle
spin-exchange interactions (j c1 = j c2 = j srf = 0) were “switched off” in the case of
clusters of nanoparticles (p = 0.72). When the g = 0 (Fig. 2.9 squares), the spins
inside each nanoparticle tends to spontaneously couple ferrimagnetically (but with