

17 Nanocomposites for Permanent Magnets
415
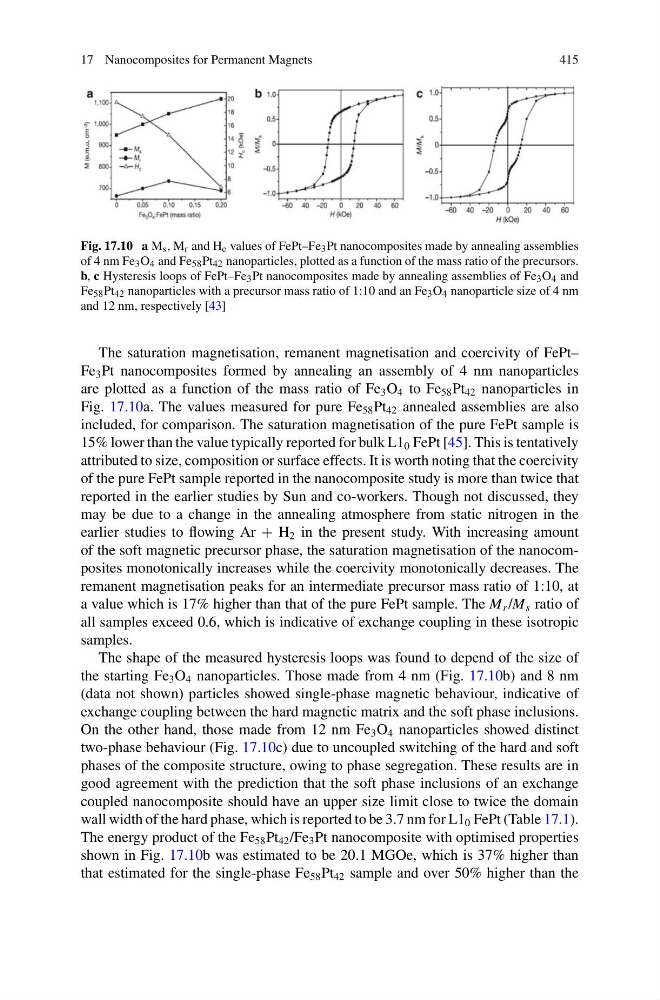
Fig. 17.10 a M s , M r and H c values of FePt–Fe 3 Pt nanocomposites made by annealing assemblies
of 4 nm Fe 3 O 4 and Fe 58 Pt 42 nanoparticles, plotted as a function of the mass ratio of the precursors.
b, c Hysteresis loops of FePt–Fe 3 Pt nanocomposites made by annealing assemblies of Fe 3 O 4 and
Fe 58 Pt 42 nanoparticles with a precursor mass ratio of 1:10 and an Fe 3 O 4 nanoparticle size of 4 nm
and 12 nm, respectively [43]
The saturation magnetisation, remanent magnetisation and coercivity of FePt–
Fe 3 Pt nanocomposites formed by annealing an assembly of 4 nm nanoparticles
are plotted as a function of the mass ratio of Fe 3 O 4 to Fe 58 Pt 42 nanoparticles in
Fig. 17.10a. The values measured for pure Fe 58 Pt 42 annealed assemblies are also
included, for comparison. The saturation magnetisation of the pure FePt sample is
15% lower than the value typically reported for bulk L1 0 FePt [45]. This is tentatively
attributed to size, composition or surface effects. It is worth noting that the coercivity
of the pure FePt sample reported in the nanocomposite study is more than twice that
reported in the earlier studies by Sun and co-workers. Though not discussed, they
may be due to a change in the annealing atmosphere from static nitrogen in the
earlier studies to flowing Ar + H 2 in the present study. With increasing amount
of the soft magnetic precursor phase, the saturation magnetisation of the nanocomposites monotonically increases while the coercivity monotonically decreases. The
remanent magnetisation peaks for an intermediate precursor mass ratio of 1:10, at
a value which is 17% higher than that of the pure FePt sample. The M r /M s ratio of
all samples exceed 0.6, which is indicative of exchange coupling in these isotropic
samples.
The shape of the measured hysteresis loops was found to depend of the size of
the starting Fe 3 O 4 nanoparticles. Those made from 4 nm (Fig. 17.10b) and 8 nm
(data not shown) particles showed single-phase magnetic behaviour, indicative of
exchange coupling between the hard magnetic matrix and the soft phase inclusions.
On the other hand, those made from 12 nm Fe 3 O 4 nanoparticles showed distinct
two-phase behaviour (Fig. 17.10c) due to uncoupled switching of the hard and soft
phases of the composite structure, owing to phase segregation. These results are in
good agreement with the prediction that the soft phase inclusions of an exchange
coupled nanocomposite should have an upper size limit close to twice the domain
wall width of the hard phase, which is reported to be 3.7 nm for L1 0 FePt (Table 17.1).
The energy product of the Fe 58 Pt 42 /Fe 3 Pt nanocomposite with optimised properties
shown in Fig. 17.10b was estimated to be 20.1 MGOe, which is 37% higher than
that estimated for the single-phase Fe 58 Pt 42 sample and over 50% higher than the
415
Fig. 17.10 a M s , M r and H c values of FePt–Fe 3 Pt nanocomposites made by annealing assemblies
of 4 nm Fe 3 O 4 and Fe 58 Pt 42 nanoparticles, plotted as a function of the mass ratio of the precursors.
b, c Hysteresis loops of FePt–Fe 3 Pt nanocomposites made by annealing assemblies of Fe 3 O 4 and
Fe 58 Pt 42 nanoparticles with a precursor mass ratio of 1:10 and an Fe 3 O 4 nanoparticle size of 4 nm
and 12 nm, respectively [43]
The saturation magnetisation, remanent magnetisation and coercivity of FePt–
Fe 3 Pt nanocomposites formed by annealing an assembly of 4 nm nanoparticles
are plotted as a function of the mass ratio of Fe 3 O 4 to Fe 58 Pt 42 nanoparticles in
Fig. 17.10a. The values measured for pure Fe 58 Pt 42 annealed assemblies are also
included, for comparison. The saturation magnetisation of the pure FePt sample is
15% lower than the value typically reported for bulk L1 0 FePt [45]. This is tentatively
attributed to size, composition or surface effects. It is worth noting that the coercivity
of the pure FePt sample reported in the nanocomposite study is more than twice that
reported in the earlier studies by Sun and co-workers. Though not discussed, they
may be due to a change in the annealing atmosphere from static nitrogen in the
earlier studies to flowing Ar + H 2 in the present study. With increasing amount
of the soft magnetic precursor phase, the saturation magnetisation of the nanocomposites monotonically increases while the coercivity monotonically decreases. The
remanent magnetisation peaks for an intermediate precursor mass ratio of 1:10, at
a value which is 17% higher than that of the pure FePt sample. The M r /M s ratio of
all samples exceed 0.6, which is indicative of exchange coupling in these isotropic
samples.
The shape of the measured hysteresis loops was found to depend of the size of
the starting Fe 3 O 4 nanoparticles. Those made from 4 nm (Fig. 17.10b) and 8 nm
(data not shown) particles showed single-phase magnetic behaviour, indicative of
exchange coupling between the hard magnetic matrix and the soft phase inclusions.
On the other hand, those made from 12 nm Fe 3 O 4 nanoparticles showed distinct
two-phase behaviour (Fig. 17.10c) due to uncoupled switching of the hard and soft
phases of the composite structure, owing to phase segregation. These results are in
good agreement with the prediction that the soft phase inclusions of an exchange
coupled nanocomposite should have an upper size limit close to twice the domain
wall width of the hard phase, which is reported to be 3.7 nm for L1 0 FePt (Table 17.1).
The energy product of the Fe 58 Pt 42 /Fe 3 Pt nanocomposite with optimised properties
shown in Fig. 17.10b was estimated to be 20.1 MGOe, which is 37% higher than
that estimated for the single-phase Fe 58 Pt 42 sample and over 50% higher than the