

1 Single Nanomagnet Behaviour: Surface and Finite-Size Effects
25
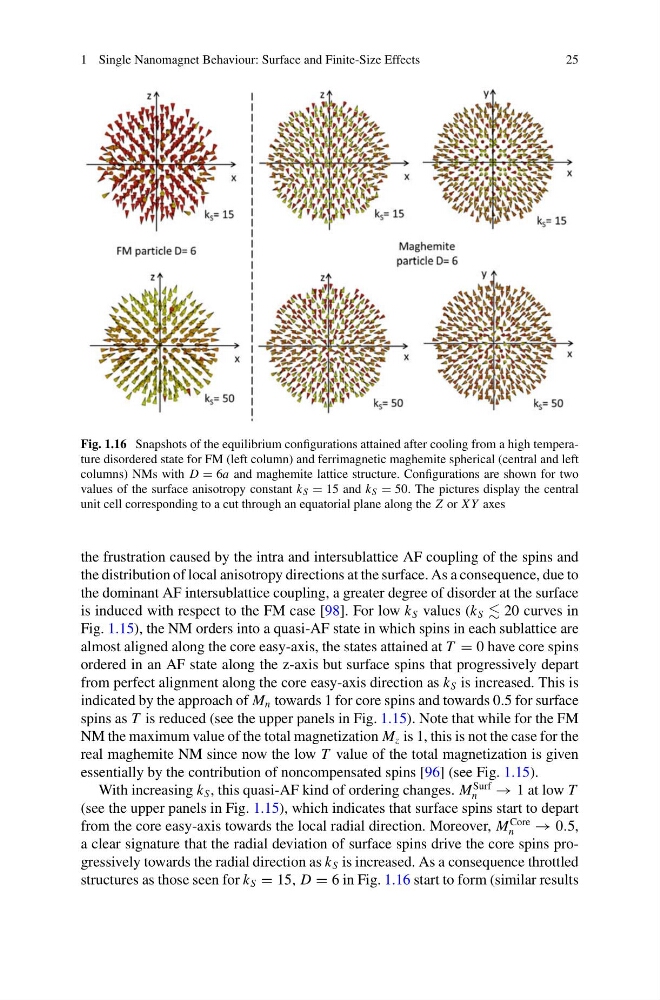
Fig. 1.16 Snapshots of the equilibrium configurations attained after cooling from a high temperature disordered state for FM (left column) and ferrimagnetic maghemite spherical (central and left
columns) NMs with D = 6a and maghemite lattice structure. Configurations are shown for two
values of the surface anisotropy constant k S = 15 and k S = 50. The pictures display the central
unit cell corresponding to a cut through an equatorial plane along the Z or XY axes
the frustration caused by the intra and intersublattice AF coupling of the spins and
the distribution of local anisotropy directions at the surface. As a consequence, due to
the dominant AF intersublattice coupling, a greater degree of disorder at the surface
is induced with respect to the FM case [98]. For low k S values (k S 20 curves in
Fig. 1.15), the NM orders into a quasi-AF state in which spins in each sublattice are
almost aligned along the core easy-axis, the states attained at T = 0 have core spins
ordered in an AF state along the z-axis but surface spins that progressively depart
from perfect alignment along the core easy-axis direction as k S is increased. This is
indicated by the approach of M n towards 1 for core spins and towards 0.5 for surface
spins as T is reduced (see the upper panels in Fig. 1.15). Note that while for the FM
NM the maximum value of the total magnetization M z is 1, this is not the case for the
real maghemite NM since now the low T value of the total magnetization is given
essentially by the contribution of noncompensated spins [96] (see Fig. 1.15).
With increasing k S , this quasi-AF kind of ordering changes. M
Surf
n
→ 1 at low T
(see the upper panels in Fig. 1.15), which indicates that surface spins start to depart
from the core easy-axis towards the local radial direction. Moreover, M
Core
n
→ 0.5,
a clear signature that the radial deviation of surface spins drive the core spins progressively towards the radial direction as k S is increased. As a consequence throttled
structures as those seen for k S = 15, D = 6 in Fig. 1.16 start to form (similar results
25
Fig. 1.16 Snapshots of the equilibrium configurations attained after cooling from a high temperature disordered state for FM (left column) and ferrimagnetic maghemite spherical (central and left
columns) NMs with D = 6a and maghemite lattice structure. Configurations are shown for two
values of the surface anisotropy constant k S = 15 and k S = 50. The pictures display the central
unit cell corresponding to a cut through an equatorial plane along the Z or XY axes
the frustration caused by the intra and intersublattice AF coupling of the spins and
the distribution of local anisotropy directions at the surface. As a consequence, due to
the dominant AF intersublattice coupling, a greater degree of disorder at the surface
is induced with respect to the FM case [98]. For low k S values (k S 20 curves in
Fig. 1.15), the NM orders into a quasi-AF state in which spins in each sublattice are
almost aligned along the core easy-axis, the states attained at T = 0 have core spins
ordered in an AF state along the z-axis but surface spins that progressively depart
from perfect alignment along the core easy-axis direction as k S is increased. This is
indicated by the approach of M n towards 1 for core spins and towards 0.5 for surface
spins as T is reduced (see the upper panels in Fig. 1.15). Note that while for the FM
NM the maximum value of the total magnetization M z is 1, this is not the case for the
real maghemite NM since now the low T value of the total magnetization is given
essentially by the contribution of noncompensated spins [96] (see Fig. 1.15).
With increasing k S , this quasi-AF kind of ordering changes. M
Surf
n
→ 1 at low T
(see the upper panels in Fig. 1.15), which indicates that surface spins start to depart
from the core easy-axis towards the local radial direction. Moreover, M
Core
n
→ 0.5,
a clear signature that the radial deviation of surface spins drive the core spins progressively towards the radial direction as k S is increased. As a consequence throttled
structures as those seen for k S = 15, D = 6 in Fig. 1.16 start to form (similar results