

320
C. Marquina
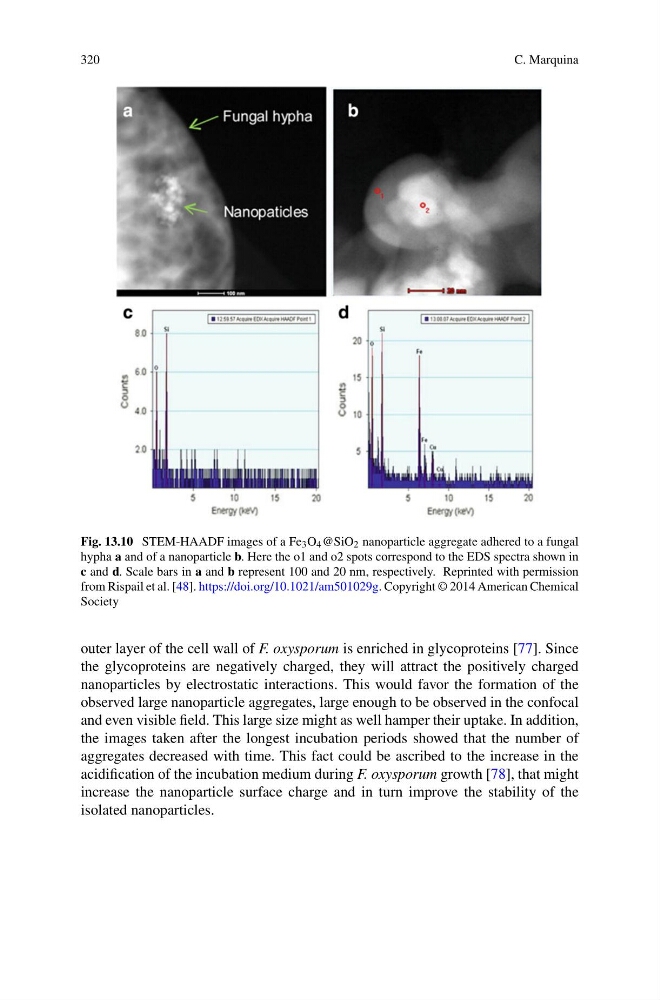
Fig. 13.10 STEM-HAADF images of a Fe 3 O 4 @SiO 2 nanoparticle aggregate adhered to a fungal
hypha a and of a nanoparticle b. Here the o1 and o2 spots correspond to the EDS spectra shown in
c and d. Scale bars in a and b represent 100 and 20 nm, respectively. Reprinted with permission
from Rispail et al. [48]. https://doi.org/10.1021/am501029g. Copyright © 2014 American Chemical
Society
outer layer of the cell wall of F. oxysporum is enriched in glycoproteins [77]. Since
the glycoproteins are negatively charged, they will attract the positively charged
nanoparticles by electrostatic interactions. This would favor the formation of the
observed large nanoparticle aggregates, large enough to be observed in the confocal
and even visible field. This large size might as well hamper their uptake. In addition,
the images taken after the longest incubation periods showed that the number of
aggregates decreased with time. This fact could be ascribed to the increase in the
acidification of the incubation medium during F. oxysporum growth [78], that might
increase the nanoparticle surface charge and in turn improve the stability of the
isolated nanoparticles.
C. Marquina
Fig. 13.10 STEM-HAADF images of a Fe 3 O 4 @SiO 2 nanoparticle aggregate adhered to a fungal
hypha a and of a nanoparticle b. Here the o1 and o2 spots correspond to the EDS spectra shown in
c and d. Scale bars in a and b represent 100 and 20 nm, respectively. Reprinted with permission
from Rispail et al. [48]. https://doi.org/10.1021/am501029g. Copyright © 2014 American Chemical
Society
outer layer of the cell wall of F. oxysporum is enriched in glycoproteins [77]. Since
the glycoproteins are negatively charged, they will attract the positively charged
nanoparticles by electrostatic interactions. This would favor the formation of the
observed large nanoparticle aggregates, large enough to be observed in the confocal
and even visible field. This large size might as well hamper their uptake. In addition,
the images taken after the longest incubation periods showed that the number of
aggregates decreased with time. This fact could be ascribed to the increase in the
acidification of the incubation medium during F. oxysporum growth [78], that might
increase the nanoparticle surface charge and in turn improve the stability of the
isolated nanoparticles.