

11 Electron Tomography
277
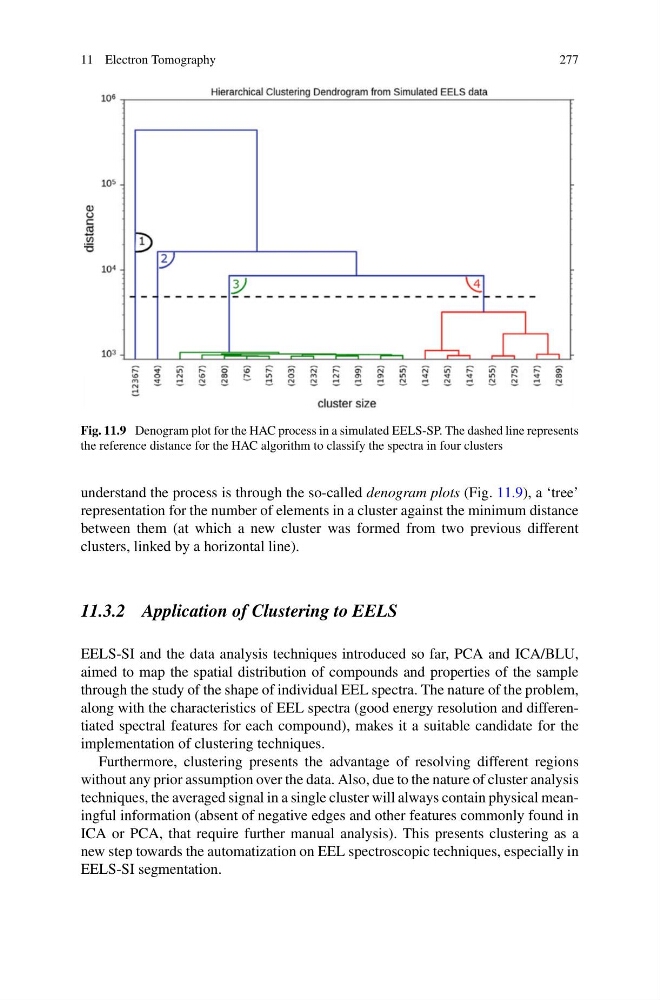
Fig. 11.9 Denogram plot for the HAC process in a simulated EELS-SP. The dashed line represents
the reference distance for the HAC algorithm to classify the spectra in four clusters
understand the process is through the so-called denogram plots (Fig. 11.9), a ‘tree’
representation for the number of elements in a cluster against the minimum distance
between them (at which a new cluster was formed from two previous different
clusters, linked by a horizontal line).
11.3.2 Application of Clustering to EELS
EELS-SI and the data analysis techniques introduced so far, PCA and ICA/BLU,
aimed to map the spatial distribution of compounds and properties of the sample
through the study of the shape of individual EEL spectra. The nature of the problem,
along with the characteristics of EEL spectra (good energy resolution and differentiated spectral features for each compound), makes it a suitable candidate for the
implementation of clustering techniques.
Furthermore, clustering presents the advantage of resolving different regions
without any prior assumption over the data. Also, due to the nature of cluster analysis
techniques, the averaged signal in a single cluster will always contain physical meaningful information (absent of negative edges and other features commonly found in
ICA or PCA, that require further manual analysis). This presents clustering as a
new step towards the automatization on EEL spectroscopic techniques, especially in
EELS-SI segmentation.
277
Fig. 11.9 Denogram plot for the HAC process in a simulated EELS-SP. The dashed line represents
the reference distance for the HAC algorithm to classify the spectra in four clusters
understand the process is through the so-called denogram plots (Fig. 11.9), a ‘tree’
representation for the number of elements in a cluster against the minimum distance
between them (at which a new cluster was formed from two previous different
clusters, linked by a horizontal line).
11.3.2 Application of Clustering to EELS
EELS-SI and the data analysis techniques introduced so far, PCA and ICA/BLU,
aimed to map the spatial distribution of compounds and properties of the sample
through the study of the shape of individual EEL spectra. The nature of the problem,
along with the characteristics of EEL spectra (good energy resolution and differentiated spectral features for each compound), makes it a suitable candidate for the
implementation of clustering techniques.
Furthermore, clustering presents the advantage of resolving different regions
without any prior assumption over the data. Also, due to the nature of cluster analysis
techniques, the averaged signal in a single cluster will always contain physical meaningful information (absent of negative edges and other features commonly found in
ICA or PCA, that require further manual analysis). This presents clustering as a
new step towards the automatization on EEL spectroscopic techniques, especially in
EELS-SI segmentation.