

11 Electron Tomography
271
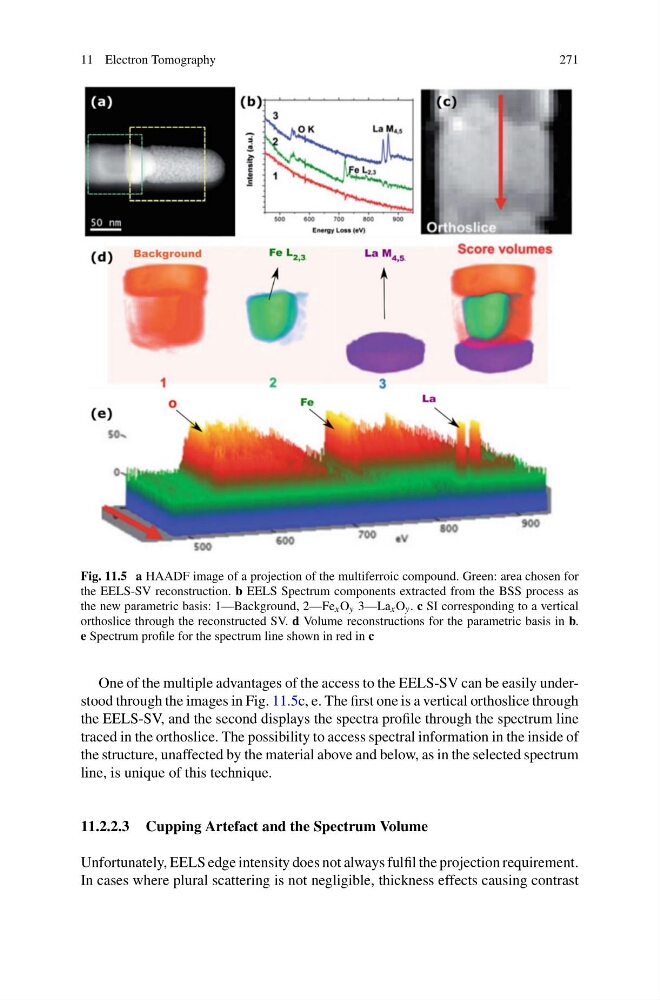
Fig. 11.5 a HAADF image of a projection of the multiferroic compound. Green: area chosen for
the EELS-SV reconstruction. b EELS Spectrum components extracted from the BSS process as
the new parametric basis: 1—Background, 2—Fe x O y 3—La x O y . c SI corresponding to a vertical
orthoslice through the reconstructed SV. d Volume reconstructions for the parametric basis in b.
e Spectrum profile for the spectrum line shown in red in c
One of the multiple advantages of the access to the EELS-SV can be easily understood through the images in Fig. 11.5c, e. The first one is a vertical orthoslice through
the EELS-SV, and the second displays the spectra profile through the spectrum line
traced in the orthoslice. The possibility to access spectral information in the inside of
the structure, unaffected by the material above and below, as in the selected spectrum
line, is unique of this technique.
11.2.2.3 Cupping Artefact and the Spectrum Volume
Unfortunately, EELS edge intensity does not always fulfil the projection requirement.
In cases where plural scattering is not negligible, thickness effects causing contrast
271
Fig. 11.5 a HAADF image of a projection of the multiferroic compound. Green: area chosen for
the EELS-SV reconstruction. b EELS Spectrum components extracted from the BSS process as
the new parametric basis: 1—Background, 2—Fe x O y 3—La x O y . c SI corresponding to a vertical
orthoslice through the reconstructed SV. d Volume reconstructions for the parametric basis in b.
e Spectrum profile for the spectrum line shown in red in c
One of the multiple advantages of the access to the EELS-SV can be easily understood through the images in Fig. 11.5c, e. The first one is a vertical orthoslice through
the EELS-SV, and the second displays the spectra profile through the spectrum line
traced in the orthoslice. The possibility to access spectral information in the inside of
the structure, unaffected by the material above and below, as in the selected spectrum
line, is unique of this technique.
11.2.2.3 Cupping Artefact and the Spectrum Volume
Unfortunately, EELS edge intensity does not always fulfil the projection requirement.
In cases where plural scattering is not negligible, thickness effects causing contrast