

10 Measuring Atomic Magnetic Moments in Magnetic Nanostructures …
249
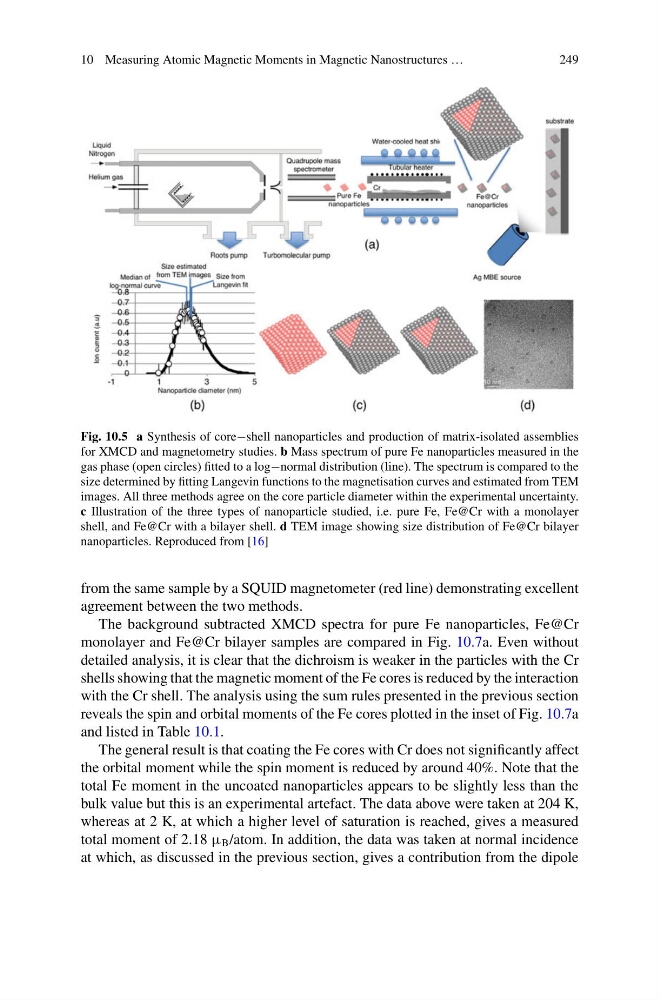
Fig. 10.5 a Synthesis of core−shell nanoparticles and production of matrix-isolated assemblies
for XMCD and magnetometry studies. b Mass spectrum of pure Fe nanoparticles measured in the
gas phase (open circles) fitted to a log−normal distribution (line). The spectrum is compared to the
size determined by fitting Langevin functions to the magnetisation curves and estimated from TEM
images. All three methods agree on the core particle diameter within the experimental uncertainty.
c Illustration of the three types of nanoparticle studied, i.e. pure Fe, Fe@Cr with a monolayer
shell, and Fe@Cr with a bilayer shell. d TEM image showing size distribution of Fe@Cr bilayer
nanoparticles. Reproduced from [16]
from the same sample by a SQUID magnetometer (red line) demonstrating excellent
agreement between the two methods.
The background subtracted XMCD spectra for pure Fe nanoparticles, Fe@Cr
monolayer and Fe@Cr bilayer samples are compared in Fig. 10.7a. Even without
detailed analysis, it is clear that the dichroism is weaker in the particles with the Cr
shells showing that the magnetic moment of the Fe cores is reduced by the interaction
with the Cr shell. The analysis using the sum rules presented in the previous section
reveals the spin and orbital moments of the Fe cores plotted in the inset of Fig. 10.7a
and listed in Table 10.1.
The general result is that coating the Fe cores with Cr does not significantly affect
the orbital moment while the spin moment is reduced by around 40%. Note that the
total Fe moment in the uncoated nanoparticles appears to be slightly less than the
bulk value but this is an experimental artefact. The data above were taken at 204 K,
whereas at 2 K, at which a higher level of saturation is reached, gives a measured
total moment of 2.18 μ B /atom. In addition, the data was taken at normal incidence
at which, as discussed in the previous section, gives a contribution from the dipole
249
Fig. 10.5 a Synthesis of core−shell nanoparticles and production of matrix-isolated assemblies
for XMCD and magnetometry studies. b Mass spectrum of pure Fe nanoparticles measured in the
gas phase (open circles) fitted to a log−normal distribution (line). The spectrum is compared to the
size determined by fitting Langevin functions to the magnetisation curves and estimated from TEM
images. All three methods agree on the core particle diameter within the experimental uncertainty.
c Illustration of the three types of nanoparticle studied, i.e. pure Fe, Fe@Cr with a monolayer
shell, and Fe@Cr with a bilayer shell. d TEM image showing size distribution of Fe@Cr bilayer
nanoparticles. Reproduced from [16]
from the same sample by a SQUID magnetometer (red line) demonstrating excellent
agreement between the two methods.
The background subtracted XMCD spectra for pure Fe nanoparticles, Fe@Cr
monolayer and Fe@Cr bilayer samples are compared in Fig. 10.7a. Even without
detailed analysis, it is clear that the dichroism is weaker in the particles with the Cr
shells showing that the magnetic moment of the Fe cores is reduced by the interaction
with the Cr shell. The analysis using the sum rules presented in the previous section
reveals the spin and orbital moments of the Fe cores plotted in the inset of Fig. 10.7a
and listed in Table 10.1.
The general result is that coating the Fe cores with Cr does not significantly affect
the orbital moment while the spin moment is reduced by around 40%. Note that the
total Fe moment in the uncoated nanoparticles appears to be slightly less than the
bulk value but this is an experimental artefact. The data above were taken at 204 K,
whereas at 2 K, at which a higher level of saturation is reached, gives a measured
total moment of 2.18 μ B /atom. In addition, the data was taken at normal incidence
at which, as discussed in the previous section, gives a contribution from the dipole