

202
J. Richardi et al.
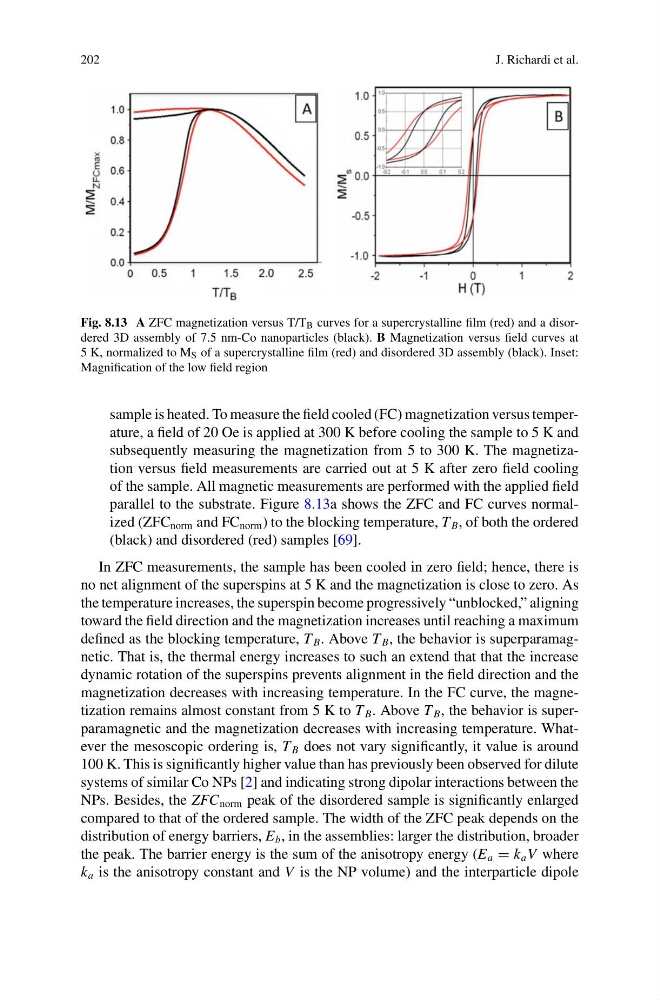
Fig. 8.13 A ZFC magnetization versus T/T B curves for a supercrystalline film (red) and a disordered 3D assembly of 7.5 nm-Co nanoparticles (black). B Magnetization versus field curves at
5 K, normalized to M S of a supercrystalline film (red) and disordered 3D assembly (black). Inset:
Magnification of the low field region
sample is heated. To measure the field cooled (FC) magnetization versus temperature, a field of 20 Oe is applied at 300 K before cooling the sample to 5 K and
subsequently measuring the magnetization from 5 to 300 K. The magnetization versus field measurements are carried out at 5 K after zero field cooling
of the sample. All magnetic measurements are performed with the applied field
parallel to the substrate. Figure 8.13a shows the ZFC and FC curves normalized (ZFC norm and FC norm ) to the blocking temperature, T B , of both the ordered
(black) and disordered (red) samples [69].
In ZFC measurements, the sample has been cooled in zero field; hence, there is
no net alignment of the superspins at 5 K and the magnetization is close to zero. As
the temperature increases, the superspin become progressively “unblocked,” aligning
toward the field direction and the magnetization increases until reaching a maximum
defined as the blocking temperature, T B . Above T B , the behavior is superparamagnetic. That is, the thermal energy increases to such an extend that that the increase
dynamic rotation of the superspins prevents alignment in the field direction and the
magnetization decreases with increasing temperature. In the FC curve, the magnetization remains almost constant from 5 K to T B . Above T B , the behavior is superparamagnetic and the magnetization decreases with increasing temperature. Whatever the mesoscopic ordering is, T B does not vary significantly, it value is around
100 K. This is significantly higher value than has previously been observed for dilute
systems of similar Co NPs [2] and indicating strong dipolar interactions between the
NPs. Besides, the ZFC norm peak of the disordered sample is significantly enlarged
compared to that of the ordered sample. The width of the ZFC peak depends on the
distribution of energy barriers, E b , in the assemblies: larger the distribution, broader
the peak. The barrier energy is the sum of the anisotropy energy (E a = k a V where
k a is the anisotropy constant and V is the NP volume) and the interparticle dipole
J. Richardi et al.
Fig. 8.13 A ZFC magnetization versus T/T B curves for a supercrystalline film (red) and a disordered 3D assembly of 7.5 nm-Co nanoparticles (black). B Magnetization versus field curves at
5 K, normalized to M S of a supercrystalline film (red) and disordered 3D assembly (black). Inset:
Magnification of the low field region
sample is heated. To measure the field cooled (FC) magnetization versus temperature, a field of 20 Oe is applied at 300 K before cooling the sample to 5 K and
subsequently measuring the magnetization from 5 to 300 K. The magnetization versus field measurements are carried out at 5 K after zero field cooling
of the sample. All magnetic measurements are performed with the applied field
parallel to the substrate. Figure 8.13a shows the ZFC and FC curves normalized (ZFC norm and FC norm ) to the blocking temperature, T B , of both the ordered
(black) and disordered (red) samples [69].
In ZFC measurements, the sample has been cooled in zero field; hence, there is
no net alignment of the superspins at 5 K and the magnetization is close to zero. As
the temperature increases, the superspin become progressively “unblocked,” aligning
toward the field direction and the magnetization increases until reaching a maximum
defined as the blocking temperature, T B . Above T B , the behavior is superparamagnetic. That is, the thermal energy increases to such an extend that that the increase
dynamic rotation of the superspins prevents alignment in the field direction and the
magnetization decreases with increasing temperature. In the FC curve, the magnetization remains almost constant from 5 K to T B . Above T B , the behavior is superparamagnetic and the magnetization decreases with increasing temperature. Whatever the mesoscopic ordering is, T B does not vary significantly, it value is around
100 K. This is significantly higher value than has previously been observed for dilute
systems of similar Co NPs [2] and indicating strong dipolar interactions between the
NPs. Besides, the ZFC norm peak of the disordered sample is significantly enlarged
compared to that of the ordered sample. The width of the ZFC peak depends on the
distribution of energy barriers, E b , in the assemblies: larger the distribution, broader
the peak. The barrier energy is the sum of the anisotropy energy (E a = k a V where
k a is the anisotropy constant and V is the NP volume) and the interparticle dipole