

7 Nature Driven Magnetic Nanoarchitectures
169
are indeed considering as negligible in the previous discussion of the Henkel plot
in Fig. 7.7a. This argument implicitly assumes that the whole chain composed of
20–30 magnetosomes behaves mostly as a large magnetic domain or equivalently
that magnetization rotation of magnetosomes belonging to a given chain is mostly
coherent. To further check this line of reasoning, it might be useful to recap the
information contained in the hysteresis loops of magnetotactic bacteria.
7.3.3 Magnetization Process of the Chain: The
Stoner-Wohlfarth Approach
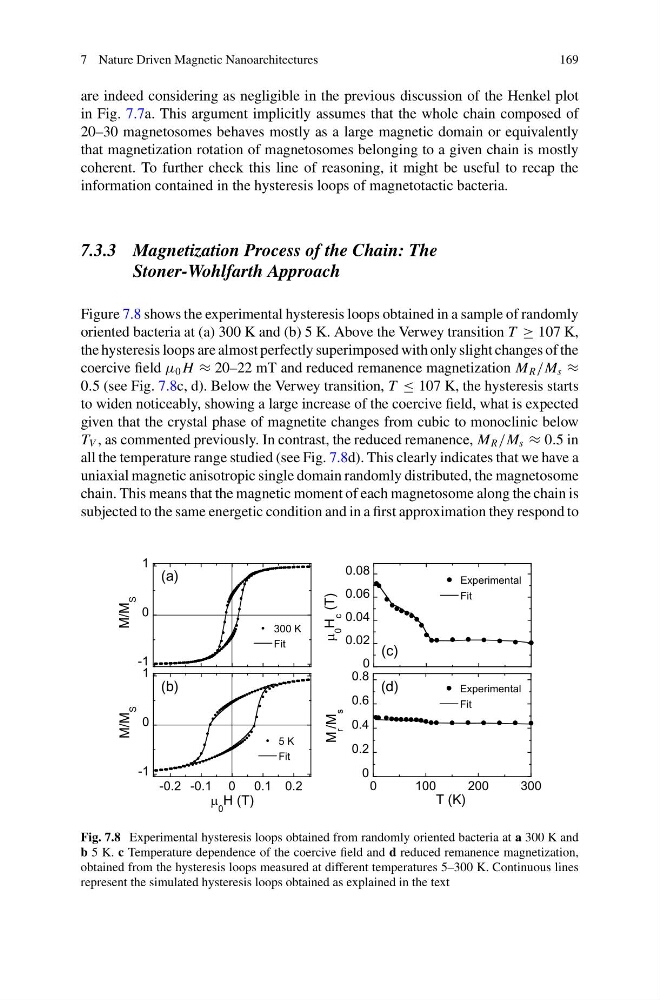
Figure 7.8 shows the experimental hysteresis loops obtained in a sample of randomly
oriented bacteria at (a) 300 K and (b) 5 K. Above the Verwey transition T ≥ 107 K,
the hysteresis loops are almost perfectly superimposed with only slight changes of the
coercive field μ 0 H ≈ 20–22 mT and reduced remanence magnetization M R /M s ≈
0.5 (see Fig. 7.8c, d). Below the Verwey transition, T ≤ 107 K, the hysteresis starts
to widen noticeably, showing a large increase of the coercive field, what is expected
given that the crystal phase of magnetite changes from cubic to monoclinic below
T V , as commented previously. In contrast, the reduced remanence, M R /M s ≈ 0.5 in
all the temperature range studied (see Fig. 7.8d). This clearly indicates that we have a
uniaxial magnetic anisotropic single domain randomly distributed, the magnetosome
chain. This means that the magnetic moment of each magnetosome along the chain is
subjected to the same energetic condition and in a first approximation they respond to
300 K
Fit
-1
0
1
M/M
S
-0.2 -0.1 0 0.1 0.2
5 K
Fit
-1
0
1
μ
0
H (T)
M/M
S
0
0.2
0.4
0.6
0.8
0
1 0 0
2 0 0
3 0 0
Experimental
Fit
M
r
/M
s
T (K)
0
0.02
0.04
0.06
0.08
Experimental
Fit
μ
0
H
c
(T)
(c)
(d)
(b)
(a)
Fig. 7.8 Experimental hysteresis loops obtained from randomly oriented bacteria at a 300 K and
b 5 K. c Temperature dependence of the coercive field and d reduced remanence magnetization,
obtained from the hysteresis loops measured at different temperatures 5–300 K. Continuous lines
represent the simulated hysteresis loops obtained as explained in the text
169
are indeed considering as negligible in the previous discussion of the Henkel plot
in Fig. 7.7a. This argument implicitly assumes that the whole chain composed of
20–30 magnetosomes behaves mostly as a large magnetic domain or equivalently
that magnetization rotation of magnetosomes belonging to a given chain is mostly
coherent. To further check this line of reasoning, it might be useful to recap the
information contained in the hysteresis loops of magnetotactic bacteria.
7.3.3 Magnetization Process of the Chain: The
Stoner-Wohlfarth Approach
Figure 7.8 shows the experimental hysteresis loops obtained in a sample of randomly
oriented bacteria at (a) 300 K and (b) 5 K. Above the Verwey transition T ≥ 107 K,
the hysteresis loops are almost perfectly superimposed with only slight changes of the
coercive field μ 0 H ≈ 20–22 mT and reduced remanence magnetization M R /M s ≈
0.5 (see Fig. 7.8c, d). Below the Verwey transition, T ≤ 107 K, the hysteresis starts
to widen noticeably, showing a large increase of the coercive field, what is expected
given that the crystal phase of magnetite changes from cubic to monoclinic below
T V , as commented previously. In contrast, the reduced remanence, M R /M s ≈ 0.5 in
all the temperature range studied (see Fig. 7.8d). This clearly indicates that we have a
uniaxial magnetic anisotropic single domain randomly distributed, the magnetosome
chain. This means that the magnetic moment of each magnetosome along the chain is
subjected to the same energetic condition and in a first approximation they respond to
300 K
Fit
-1
0
1
M/M
S
-0.2 -0.1 0 0.1 0.2
5 K
Fit
-1
0
1
μ
0
H (T)
M/M
S
0
0.2
0.4
0.6
0.8
0
1 0 0
2 0 0
3 0 0
Experimental
Fit
M
r
/M
s
T (K)
0
0.02
0.04
0.06
0.08
Experimental
Fit
μ
0
H
c
(T)
(c)
(d)
(b)
(a)
Fig. 7.8 Experimental hysteresis loops obtained from randomly oriented bacteria at a 300 K and
b 5 K. c Temperature dependence of the coercive field and d reduced remanence magnetization,
obtained from the hysteresis loops measured at different temperatures 5–300 K. Continuous lines
represent the simulated hysteresis loops obtained as explained in the text