

7 Nature Driven Magnetic Nanoarchitectures
167
(a)
0
100
200
300
M (a.u.)
T (K)
(b)
FC
ZFC
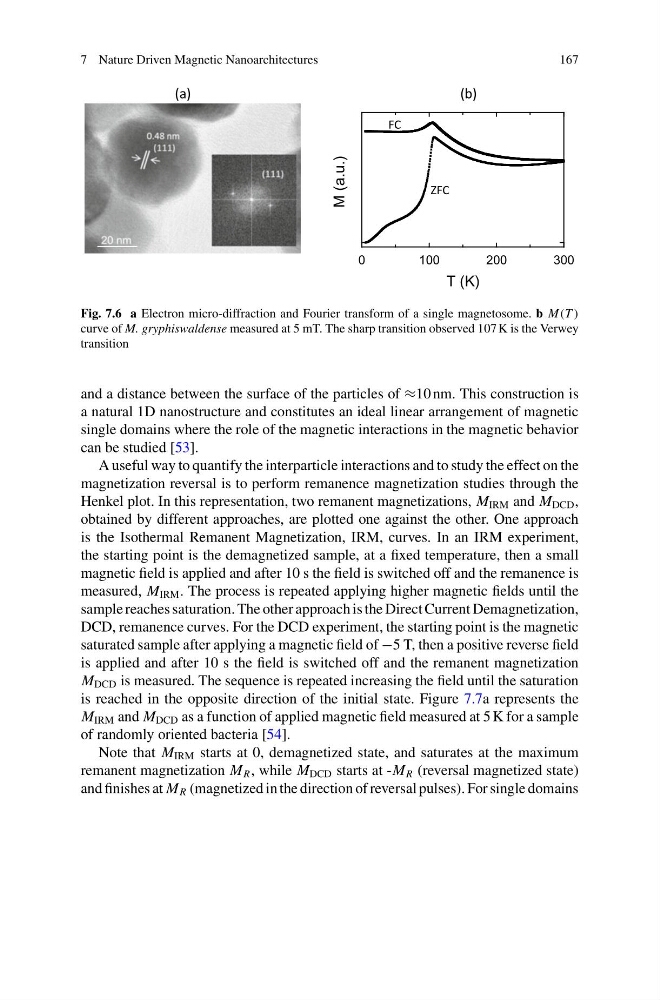
Fig. 7.6 a Electron micro-diffraction and Fourier transform of a single magnetosome. b M(T )
curve of M. gryphiswaldense measured at 5 mT. The sharp transition observed 107 K is the Verwey
transition
and a distance between the surface of the particles of ≈10 nm. This construction is
a natural 1D nanostructure and constitutes an ideal linear arrangement of magnetic
single domains where the role of the magnetic interactions in the magnetic behavior
can be studied [53].
A useful way to quantify the interparticle interactions and to study the effect on the
magnetization reversal is to perform remanence magnetization studies through the
Henkel plot. In this representation, two remanent magnetizations, M IRM and M DCD ,
obtained by different approaches, are plotted one against the other. One approach
is the Isothermal Remanent Magnetization, IRM, curves. In an IRM experiment,
the starting point is the demagnetized sample, at a fixed temperature, then a small
magnetic field is applied and after 10 s the field is switched off and the remanence is
measured, M IRM . The process is repeated applying higher magnetic fields until the
sample reaches saturation. The other approach is the Direct Current Demagnetization,
DCD, remanence curves. For the DCD experiment, the starting point is the magnetic
saturated sample after applying a magnetic field of −5 T, then a positive reverse field
is applied and after 10 s the field is switched off and the remanent magnetization
M DCD is measured. The sequence is repeated increasing the field until the saturation
is reached in the opposite direction of the initial state. Figure 7.7a represents the
M IRM and M DCD as a function of applied magnetic field measured at 5 K for a sample
of randomly oriented bacteria [54].
Note that M IRM starts at 0, demagnetized state, and saturates at the maximum
remanent magnetization M R , while M DCD starts at -M R (reversal magnetized state)
and finishes at M R (magnetized in the direction of reversal pulses). For single domains
167
(a)
0
100
200
300
M (a.u.)
T (K)
(b)
FC
ZFC
Fig. 7.6 a Electron micro-diffraction and Fourier transform of a single magnetosome. b M(T )
curve of M. gryphiswaldense measured at 5 mT. The sharp transition observed 107 K is the Verwey
transition
and a distance between the surface of the particles of ≈10 nm. This construction is
a natural 1D nanostructure and constitutes an ideal linear arrangement of magnetic
single domains where the role of the magnetic interactions in the magnetic behavior
can be studied [53].
A useful way to quantify the interparticle interactions and to study the effect on the
magnetization reversal is to perform remanence magnetization studies through the
Henkel plot. In this representation, two remanent magnetizations, M IRM and M DCD ,
obtained by different approaches, are plotted one against the other. One approach
is the Isothermal Remanent Magnetization, IRM, curves. In an IRM experiment,
the starting point is the demagnetized sample, at a fixed temperature, then a small
magnetic field is applied and after 10 s the field is switched off and the remanence is
measured, M IRM . The process is repeated applying higher magnetic fields until the
sample reaches saturation. The other approach is the Direct Current Demagnetization,
DCD, remanence curves. For the DCD experiment, the starting point is the magnetic
saturated sample after applying a magnetic field of −5 T, then a positive reverse field
is applied and after 10 s the field is switched off and the remanent magnetization
M DCD is measured. The sequence is repeated increasing the field until the saturation
is reached in the opposite direction of the initial state. Figure 7.7a represents the
M IRM and M DCD as a function of applied magnetic field measured at 5 K for a sample
of randomly oriented bacteria [54].
Note that M IRM starts at 0, demagnetized state, and saturates at the maximum
remanent magnetization M R , while M DCD starts at -M R (reversal magnetized state)
and finishes at M R (magnetized in the direction of reversal pulses). For single domains