

96
2 Critical Mass, Efficiency, and Yield
0
2
4
6
8
10
12
14
0
0.1
0.2
0.3
0.4
0.5
0.6
0.7
0.8
0.9
1
1.1
yield (kt)
alpha
time (microseconds)
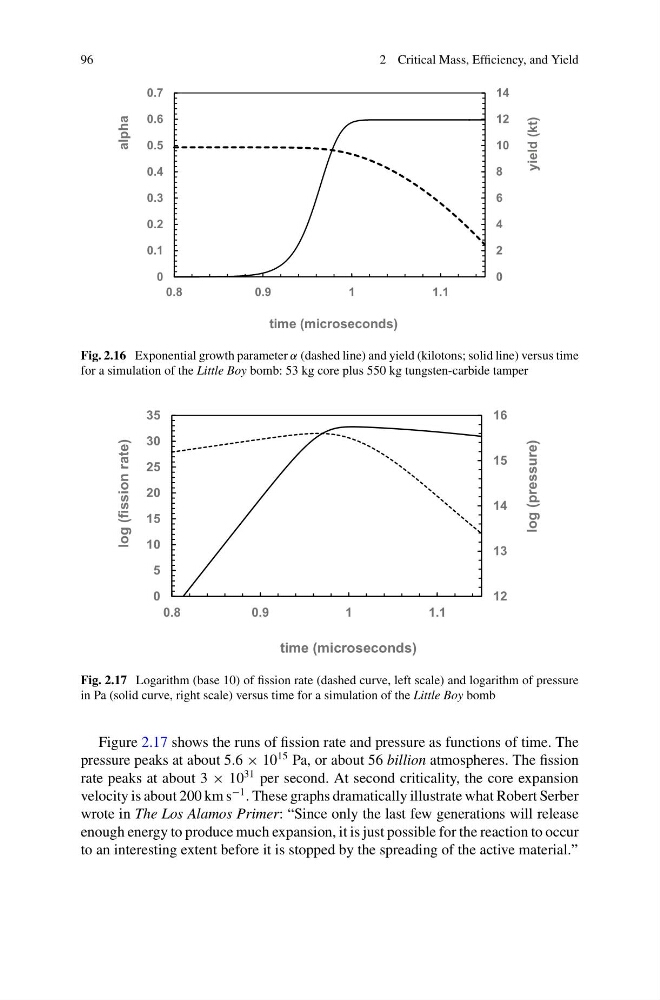
Fig. 2.16 Exponential growth parameter α (dashed line) and yield (kilotons; solid line) versus time
for a simulation of the Little Boy bomb: 53 kg core plus 550 kg tungsten-carbide tamper
12
13
14
15
16
0
5
10
15
20
25
30
35
0.8
0.9
1
1.1
log (pressure)
log (fission rate)
time (microseconds)
Fig. 2.17 Logarithm (base 10) of fission rate (dashed curve, left scale) and logarithm of pressure
in Pa (solid curve, right scale) versus time for a simulation of the Little Boy bomb
Figure 2.17 shows the runs of fission rate and pressure as functions of time. The
pressure peaks at about 5.6 × 10
15 Pa, or about 56 billion atmospheres. The fission
rate peaks at about 3 × 10
31 per second. At second criticality, the core expansion
velocity is about 200 km s
−1 . These graphs dramatically illustrate what Robert Serber
wrote in The Los Alamos Primer: “Since only the last few generations will release
enough energy to produce much expansion, it is just possible for the reaction to occur
to an interesting extent before it is stopped by the spreading of the active material.”
2 Critical Mass, Efficiency, and Yield
0
2
4
6
8
10
12
14
0
0.1
0.2
0.3
0.4
0.5
0.6
0.7
0.8
0.9
1
1.1
yield (kt)
alpha
time (microseconds)
Fig. 2.16 Exponential growth parameter α (dashed line) and yield (kilotons; solid line) versus time
for a simulation of the Little Boy bomb: 53 kg core plus 550 kg tungsten-carbide tamper
12
13
14
15
16
0
5
10
15
20
25
30
35
0.8
0.9
1
1.1
log (pressure)
log (fission rate)
time (microseconds)
Fig. 2.17 Logarithm (base 10) of fission rate (dashed curve, left scale) and logarithm of pressure
in Pa (solid curve, right scale) versus time for a simulation of the Little Boy bomb
Figure 2.17 shows the runs of fission rate and pressure as functions of time. The
pressure peaks at about 5.6 × 10
15 Pa, or about 56 billion atmospheres. The fission
rate peaks at about 3 × 10
31 per second. At second criticality, the core expansion
velocity is about 200 km s
−1 . These graphs dramatically illustrate what Robert Serber
wrote in The Los Alamos Primer: “Since only the last few generations will release
enough energy to produce much expansion, it is just possible for the reaction to occur
to an interesting extent before it is stopped by the spreading of the active material.”