

1973). Similarly, Delisle et al. (1984) conducted a study to evaluated the nutritive
value of soybean, rapeseed, and wheat flours in Sprague-Dawley male rats and
reported higher protein efficiency ratio and apparent digestibility coefficient for
rapeseed meal (2.64 Æ 0.10 and 82.5 Æ 0.57) when compared to soybean
(2.19 Æ 0.10 and 76.1 Æ 0.63). In another study conducted by Bos et al. (2007) in
humans, post-prandial biological value was found to be higher for rapeseed protein
(84.0) than that of milk (82.0), soybean (80), wheat (73), pea (79), and lupin (81.5)
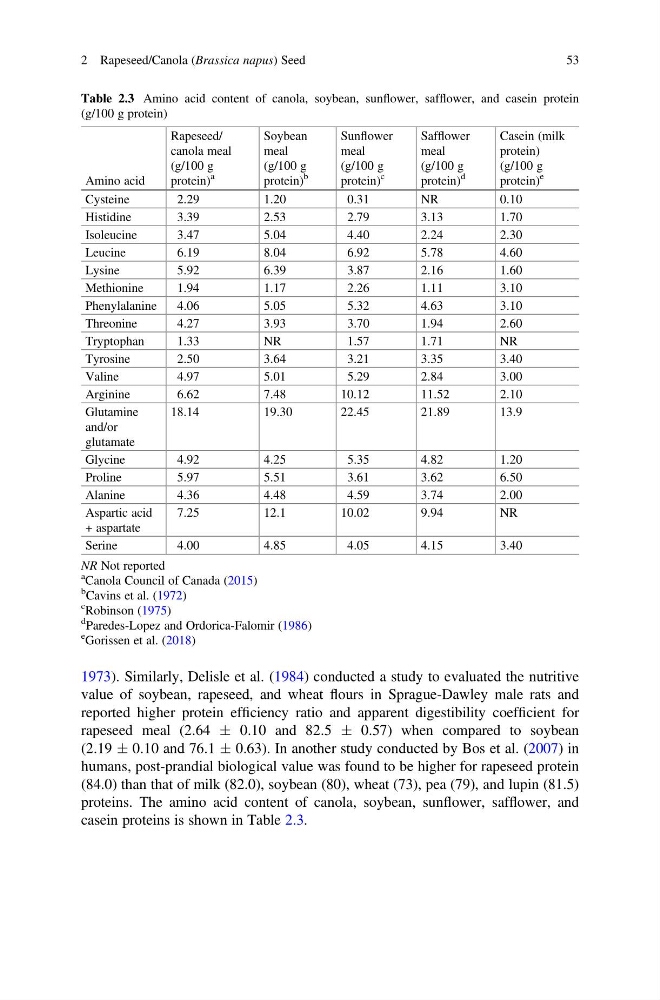
proteins. The amino acid content of canola, soybean, sunflower, safflower, and
casein proteins is shown in Table 2.3.
Table 2.3 Amino acid content of canola, soybean, sunflower, safflower, and casein protein
(g/100 g protein)
Amino acid
Rapeseed/
canola meal
(g/100 g
protein)
a
Soybean
meal
(g/100 g
protein)
b
Sunflower
meal
(g/100 g
protein)
c
Safflower
meal
(g/100 g
protein)
d
Casein (milk
protein)
(g/100 g
protein)
e
Cysteine
2.29
1.20
0.31
NR
0.10
Histidine
3.39
2.53
2.79
3.13
1.70
Isoleucine
3.47
5.04
4.40
2.24
2.30
Leucine
6.19
8.04
6.92
5.78
4.60
Lysine
5.92
6.39
3.87
2.16
1.60
Methionine
1.94
1.17
2.26
1.11
3.10
Phenylalanine
4.06
5.05
5.32
4.63
3.10
Threonine
4.27
3.93
3.70
1.94
2.60
Tryptophan
1.33
NR
1.57
1.71
NR
Tyrosine
2.50
3.64
3.21
3.35
3.40
Valine
4.97
5.01
5.29
2.84
3.00
Arginine
6.62
7.48
10.12
11.52
2.10
Glutamine
and/or
glutamate
18.14
19.30
22.45
21.89
13.9
Glycine
4.92
4.25
5.35
4.82
1.20
Proline
5.97
5.51
3.61
3.62
6.50
Alanine
4.36
4.48
4.59
3.74
2.00
Aspartic acid
+ aspartate
7.25
12.1
10.02
9.94
NR
Serine
4.00
4.85
4.05
4.15
3.40
NR Not reported
a Canola Council of Canada (2015)
b
Cavins et al. (1972)
c Robinson (1975)
d
Paredes-Lopez and Ordorica-Falomir (1986)
e Gorissen et al. (2018)
2 Rapeseed/Canola (Brassica napus) Seed
53
value of soybean, rapeseed, and wheat flours in Sprague-Dawley male rats and
reported higher protein efficiency ratio and apparent digestibility coefficient for
rapeseed meal (2.64 Æ 0.10 and 82.5 Æ 0.57) when compared to soybean
(2.19 Æ 0.10 and 76.1 Æ 0.63). In another study conducted by Bos et al. (2007) in
humans, post-prandial biological value was found to be higher for rapeseed protein
(84.0) than that of milk (82.0), soybean (80), wheat (73), pea (79), and lupin (81.5)
proteins. The amino acid content of canola, soybean, sunflower, safflower, and
casein proteins is shown in Table 2.3.
Table 2.3 Amino acid content of canola, soybean, sunflower, safflower, and casein protein
(g/100 g protein)
Amino acid
Rapeseed/
canola meal
(g/100 g
protein)
a
Soybean
meal
(g/100 g
protein)
b
Sunflower
meal
(g/100 g
protein)
c
Safflower
meal
(g/100 g
protein)
d
Casein (milk
protein)
(g/100 g
protein)
e
Cysteine
2.29
1.20
0.31
NR
0.10
Histidine
3.39
2.53
2.79
3.13
1.70
Isoleucine
3.47
5.04
4.40
2.24
2.30
Leucine
6.19
8.04
6.92
5.78
4.60
Lysine
5.92
6.39
3.87
2.16
1.60
Methionine
1.94
1.17
2.26
1.11
3.10
Phenylalanine
4.06
5.05
5.32
4.63
3.10
Threonine
4.27
3.93
3.70
1.94
2.60
Tryptophan
1.33
NR
1.57
1.71
NR
Tyrosine
2.50
3.64
3.21
3.35
3.40
Valine
4.97
5.01
5.29
2.84
3.00
Arginine
6.62
7.48
10.12
11.52
2.10
Glutamine
and/or
glutamate
18.14
19.30
22.45
21.89
13.9
Glycine
4.92
4.25
5.35
4.82
1.20
Proline
5.97
5.51
3.61
3.62
6.50
Alanine
4.36
4.48
4.59
3.74
2.00
Aspartic acid
+ aspartate
7.25
12.1
10.02
9.94
NR
Serine
4.00
4.85
4.05
4.15
3.40
NR Not reported
a Canola Council of Canada (2015)
b
Cavins et al. (1972)
c Robinson (1975)
d
Paredes-Lopez and Ordorica-Falomir (1986)
e Gorissen et al. (2018)
2 Rapeseed/Canola (Brassica napus) Seed
53