

3.3 Inconsistent Power Generation by States
85
-9
-4
-100
-100
-43
-100
-22
-100
-8
-100
-11
-44
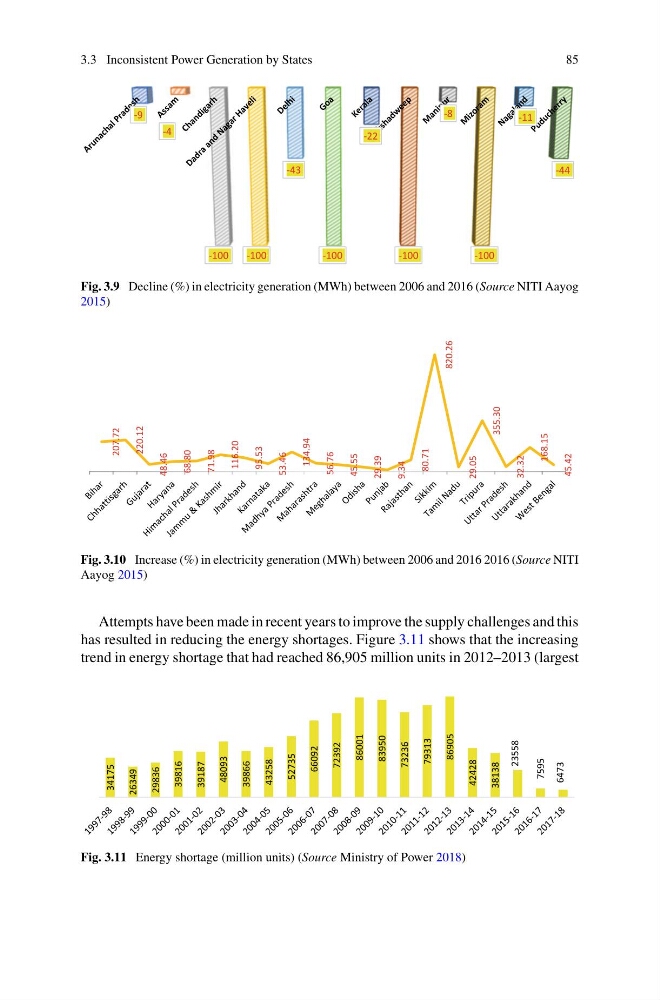
Fig. 3.9 Decline (%) in electricity generation (MWh) between 2006 and 2016 (Source NITI Aayog
2015)
207.72
220.12
48.46
68.80
71.98
116.20
95.53
53.46
134.94
56.76
45.55
29.39
9.34
80.71
820.26
29.05
355.30
32.32
168.15
45.42
Fig. 3.10 Increase (%) in electricity generation (MWh) between 2006 and 2016 2016 (Source NITI
Aayog 2015)
Attempts have been made in recent years to improve the supply challenges and this
has resulted in reducing the energy shortages. Figure 3.11 shows that the increasing
trend in energy shortage that had reached 86,905 million units in 2012–2013 (largest
34175
26349
29836
39816
39187
48093
39866
43258
52735
66092
72392
86001
83950
73236
79313
86905
42428
38138
23558
7595
6473
Fig. 3.11 Energy shortage (million units) (Source Ministry of Power 2018)
85
-9
-4
-100
-100
-43
-100
-22
-100
-8
-100
-11
-44
Fig. 3.9 Decline (%) in electricity generation (MWh) between 2006 and 2016 (Source NITI Aayog
2015)
207.72
220.12
48.46
68.80
71.98
116.20
95.53
53.46
134.94
56.76
45.55
29.39
9.34
80.71
820.26
29.05
355.30
32.32
168.15
45.42
Fig. 3.10 Increase (%) in electricity generation (MWh) between 2006 and 2016 2016 (Source NITI
Aayog 2015)
Attempts have been made in recent years to improve the supply challenges and this
has resulted in reducing the energy shortages. Figure 3.11 shows that the increasing
trend in energy shortage that had reached 86,905 million units in 2012–2013 (largest
34175
26349
29836
39816
39187
48093
39866
43258
52735
66092
72392
86001
83950
73236
79313
86905
42428
38138
23558
7595
6473
Fig. 3.11 Energy shortage (million units) (Source Ministry of Power 2018)