

2.5 The Complexities of Renewable Energy
69
1960–61
1970–71
1980–81
1990–91
2000–01
2006–07
2011–12*
63.46
58.97
52.08
40.27
31.57
27.37
23.64
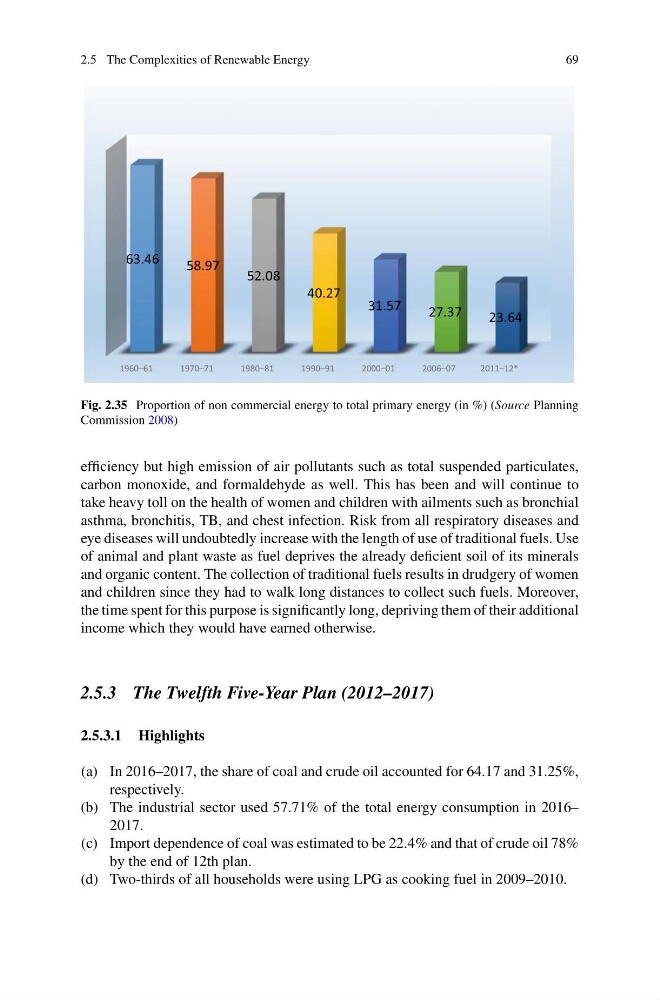
Fig. 2.35 Proportion of non commercial energy to total primary energy (in %) (Source Planning
Commission 2008)
efficiency but high emission of air pollutants such as total suspended particulates,
carbon monoxide, and formaldehyde as well. This has been and will continue to
take heavy toll on the health of women and children with ailments such as bronchial
asthma, bronchitis, TB, and chest infection. Risk from all respiratory diseases and
eye diseases will undoubtedly increase with the length of use of traditional fuels. Use
of animal and plant waste as fuel deprives the already deficient soil of its minerals
and organic content. The collection of traditional fuels results in drudgery of women
and children since they had to walk long distances to collect such fuels. Moreover,
the time spent for this purpose is significantly long, depriving them of their additional
income which they would have earned otherwise.
2.5.3 The Twelfth Five-Year Plan (2012–2017)
2.5.3.1 Highlights
(a) In 2016–2017, the share of coal and crude oil accounted for 64.17 and 31.25%,
respectively.
(b) The industrial sector used 57.71% of the total energy consumption in 2016–
2017.
(c) Import dependence of coal was estimated to be 22.4% and that of crude oil 78%
by the end of 12th plan.
(d) Two-thirds of all households were using LPG as cooking fuel in 2009–2010.
69
1960–61
1970–71
1980–81
1990–91
2000–01
2006–07
2011–12*
63.46
58.97
52.08
40.27
31.57
27.37
23.64
Fig. 2.35 Proportion of non commercial energy to total primary energy (in %) (Source Planning
Commission 2008)
efficiency but high emission of air pollutants such as total suspended particulates,
carbon monoxide, and formaldehyde as well. This has been and will continue to
take heavy toll on the health of women and children with ailments such as bronchial
asthma, bronchitis, TB, and chest infection. Risk from all respiratory diseases and
eye diseases will undoubtedly increase with the length of use of traditional fuels. Use
of animal and plant waste as fuel deprives the already deficient soil of its minerals
and organic content. The collection of traditional fuels results in drudgery of women
and children since they had to walk long distances to collect such fuels. Moreover,
the time spent for this purpose is significantly long, depriving them of their additional
income which they would have earned otherwise.
2.5.3 The Twelfth Five-Year Plan (2012–2017)
2.5.3.1 Highlights
(a) In 2016–2017, the share of coal and crude oil accounted for 64.17 and 31.25%,
respectively.
(b) The industrial sector used 57.71% of the total energy consumption in 2016–
2017.
(c) Import dependence of coal was estimated to be 22.4% and that of crude oil 78%
by the end of 12th plan.
(d) Two-thirds of all households were using LPG as cooking fuel in 2009–2010.