

2.4 Part III (Emergence of Renewable Sources)
59
energy consumed in the country. Among the indigenously produced primary commercial fuels, the relative share of oil and gas increased from 1.2% in 1950–1951 to 33%
in 1990–1991, whereas the share of coal declined from about 98% in 1950–1951
to 61.8% in 1990–1991. More and more commercial energy was supplied to the
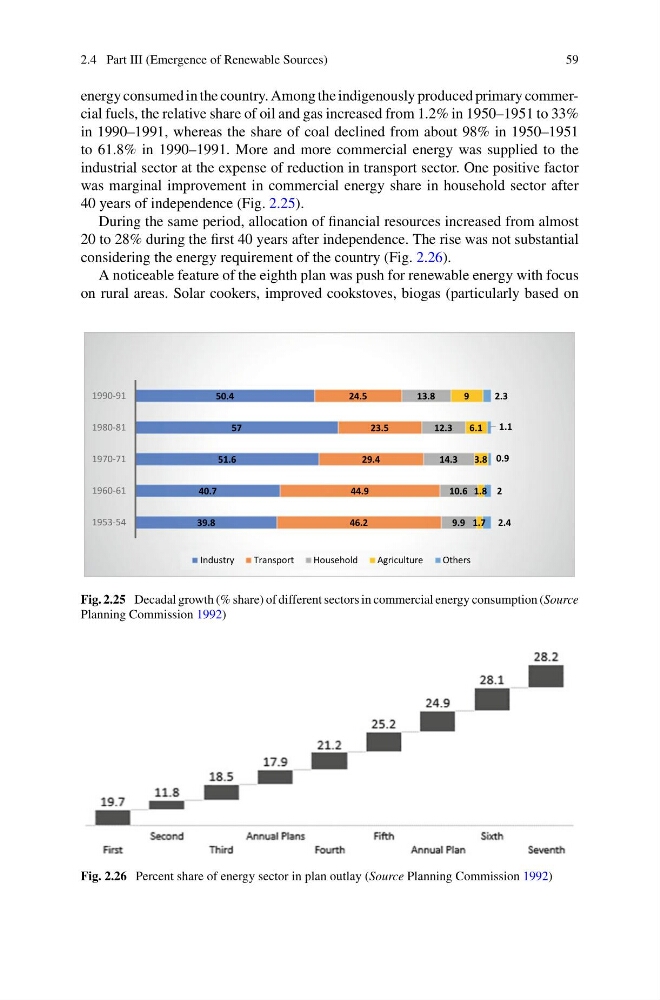
industrial sector at the expense of reduction in transport sector. One positive factor
was marginal improvement in commercial energy share in household sector after
40 years of independence (Fig. 2.25).
During the same period, allocation of financial resources increased from almost
20 to 28% during the first 40 years after independence. The rise was not substantial
considering the energy requirement of the country (Fig. 2.26).
A noticeable feature of the eighth plan was push for renewable energy with focus
on rural areas. Solar cookers, improved cookstoves, biogas (particularly based on
39.8
40.7
51.6
57
50.4
46.2
44.9
29.4
23.5
24.5
9.9
10.6
14.3
12.3
13.8
1.7
1.8
3.8
6.1
9
2.4
2
0.9
1.1
2.3
1953-54
1960-61
1970-71
1980-81
1990-91
Industry
Transport
Household
Agriculture
Others
Fig. 2.25 Decadal growth (% share) of different sectors in commercial energy consumption (Source
Planning Commission 1992)
Fig. 2.26 Percent share of energy sector in plan outlay (Source Planning Commission 1992)
59
energy consumed in the country. Among the indigenously produced primary commercial fuels, the relative share of oil and gas increased from 1.2% in 1950–1951 to 33%
in 1990–1991, whereas the share of coal declined from about 98% in 1950–1951
to 61.8% in 1990–1991. More and more commercial energy was supplied to the
industrial sector at the expense of reduction in transport sector. One positive factor
was marginal improvement in commercial energy share in household sector after
40 years of independence (Fig. 2.25).
During the same period, allocation of financial resources increased from almost
20 to 28% during the first 40 years after independence. The rise was not substantial
considering the energy requirement of the country (Fig. 2.26).
A noticeable feature of the eighth plan was push for renewable energy with focus
on rural areas. Solar cookers, improved cookstoves, biogas (particularly based on
39.8
40.7
51.6
57
50.4
46.2
44.9
29.4
23.5
24.5
9.9
10.6
14.3
12.3
13.8
1.7
1.8
3.8
6.1
9
2.4
2
0.9
1.1
2.3
1953-54
1960-61
1970-71
1980-81
1990-91
Industry
Transport
Household
Agriculture
Others
Fig. 2.25 Decadal growth (% share) of different sectors in commercial energy consumption (Source
Planning Commission 1992)
Fig. 2.26 Percent share of energy sector in plan outlay (Source Planning Commission 1992)