

24
1 Energy Security and Sustainability: An Overview
11. Energy research in energy efficiency, nuclear fission and fusion, hydrogen and
fuel cells, and storage technologies.
12. Climate change impacts are less talked about but are serious threat to energy
security, especially to thermal and hydropower plants. Thermal power plants
require water for cooling and hydel plants need it for running the turbines.
Short supply of water in the event of severe and continuous drought can affect
power generation. Poland suffered low power generation in August 2015 due to
less water availability for cooling in thermal power plants severely impacting
manufacturing sector. El Nino effect on global rainfall pattern appears to be
biggest security threat to the movement of ships and containers. One glaring
event in 2019 was the lowering of water level in Panama Canal. Under normal
rainy season (mid-April to mid-December) the water level in lake Gatun of
Panama Canal remains at 26.5 meters above MSL and falls to 25.9 meters
during dry season. If the water level falls below 24.4 meters (due to drought or
prolonged dry spell), movement of large container ships is stopped. In 2019,
the water level went down by 1.8 meters from normal level threatening the
movement of containers. This is attributed to El Nino effect that is responsible
for prolonged droughts in the Panama Canal Watershed area since 2014–2015.
1.4 Energy Security and Access in India
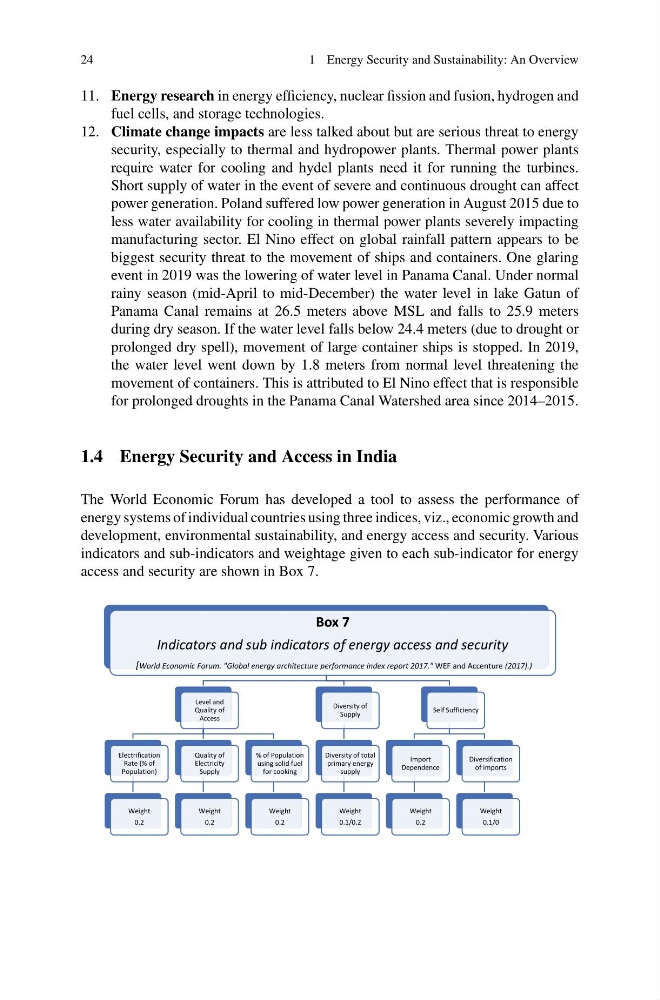
The World Economic Forum has developed a tool to assess the performance of
energy systems of individual countries using three indices, viz., economic growth and
development, environmental sustainability, and energy access and security. Various
indicators and sub-indicators and weightage given to each sub-indicator for energy
access and security are shown in Box 7.
Box 7
Indicators and sub indicators of energy access and security
[World Economic Forum. "Global energy architecture performance index report 2017." WEF and Accenture (2017].)
Level and
Quality of
Access
Electrification
Rate (% of
Population)
Weight
0.2
Quality of
Electricity
Supply
Weight
0.2
% of Population
using solid fuel
for cooking
Weight
0.2
Diversity of
Supply
Diversity of total
primary energy
supply
Weight
0.1/0.2
Self Sufficiency
Import
Dependence
Weight
0.2
Diversification
of imports
Weight
0.1/0
1 Energy Security and Sustainability: An Overview
11. Energy research in energy efficiency, nuclear fission and fusion, hydrogen and
fuel cells, and storage technologies.
12. Climate change impacts are less talked about but are serious threat to energy
security, especially to thermal and hydropower plants. Thermal power plants
require water for cooling and hydel plants need it for running the turbines.
Short supply of water in the event of severe and continuous drought can affect
power generation. Poland suffered low power generation in August 2015 due to
less water availability for cooling in thermal power plants severely impacting
manufacturing sector. El Nino effect on global rainfall pattern appears to be
biggest security threat to the movement of ships and containers. One glaring
event in 2019 was the lowering of water level in Panama Canal. Under normal
rainy season (mid-April to mid-December) the water level in lake Gatun of
Panama Canal remains at 26.5 meters above MSL and falls to 25.9 meters
during dry season. If the water level falls below 24.4 meters (due to drought or
prolonged dry spell), movement of large container ships is stopped. In 2019,
the water level went down by 1.8 meters from normal level threatening the
movement of containers. This is attributed to El Nino effect that is responsible
for prolonged droughts in the Panama Canal Watershed area since 2014–2015.
1.4 Energy Security and Access in India
The World Economic Forum has developed a tool to assess the performance of
energy systems of individual countries using three indices, viz., economic growth and
development, environmental sustainability, and energy access and security. Various
indicators and sub-indicators and weightage given to each sub-indicator for energy
access and security are shown in Box 7.
Box 7
Indicators and sub indicators of energy access and security
[World Economic Forum. "Global energy architecture performance index report 2017." WEF and Accenture (2017].)
Level and
Quality of
Access
Electrification
Rate (% of
Population)
Weight
0.2
Quality of
Electricity
Supply
Weight
0.2
% of Population
using solid fuel
for cooking
Weight
0.2
Diversity of
Supply
Diversity of total
primary energy
supply
Weight
0.1/0.2
Self Sufficiency
Import
Dependence
Weight
0.2
Diversification
of imports
Weight
0.1/0