

4.1 Utilizing Electron Emission Current Measurement
77
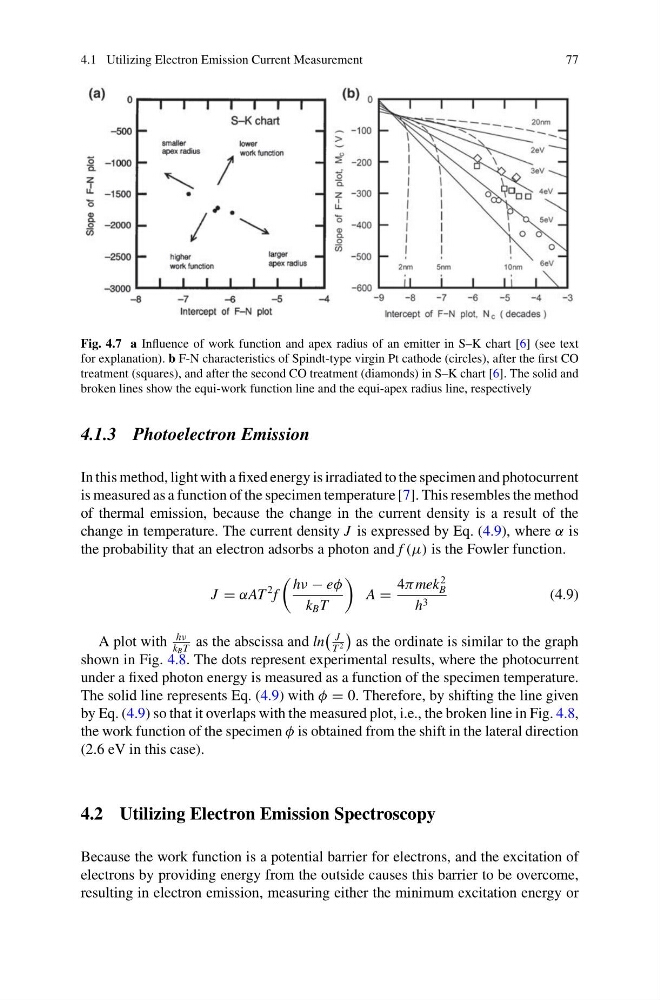
Fig. 4.7 a Influence of work function and apex radius of an emitter in S–K chart [6] (see text
for explanation). b F-N characteristics of Spindt-type virgin Pt cathode (circles), after the first CO
treatment (squares), and after the second CO treatment (diamonds) in S–K chart [6]. The solid and
broken lines show the equi-work function line and the equi-apex radius line, respectively
4.1.3 Photoelectron Emission
In this method, light with a fixed energy is irradiated to the specimen and photocurrent
is measured as a function of the specimen temperature [7]. This resembles the method
of thermal emission, because the change in the current density is a result of the
change in temperature. The current density J is expressed by Eq. (4.9), where α is
the probability that an electron adsorbs a photon and f (μ) is the Fowler function.
J = αAT
2 f
hν − eφ
k B T
A =
4π mek
2
B
h 3
(4.9)
A plot with
hν
k B T
as the abscissa and ln
J
T 2
as the ordinate is similar to the graph
shown in Fig. 4.8. The dots represent experimental results, where the photocurrent
under a fixed photon energy is measured as a function of the specimen temperature.
The solid line represents Eq. (4.9) with φ = 0. Therefore, by shifting the line given
by Eq. (4.9) so that it overlaps with the measured plot, i.e., the broken line in Fig. 4.8,
the work function of the specimen φ is obtained from the shift in the lateral direction
(2.6 eV in this case).
4.2 Utilizing Electron Emission Spectroscopy
Because the work function is a potential barrier for electrons, and the excitation of
electrons by providing energy from the outside causes this barrier to be overcome,
resulting in electron emission, measuring either the minimum excitation energy or
77
Fig. 4.7 a Influence of work function and apex radius of an emitter in S–K chart [6] (see text
for explanation). b F-N characteristics of Spindt-type virgin Pt cathode (circles), after the first CO
treatment (squares), and after the second CO treatment (diamonds) in S–K chart [6]. The solid and
broken lines show the equi-work function line and the equi-apex radius line, respectively
4.1.3 Photoelectron Emission
In this method, light with a fixed energy is irradiated to the specimen and photocurrent
is measured as a function of the specimen temperature [7]. This resembles the method
of thermal emission, because the change in the current density is a result of the
change in temperature. The current density J is expressed by Eq. (4.9), where α is
the probability that an electron adsorbs a photon and f (μ) is the Fowler function.
J = αAT
2 f
hν − eφ
k B T
A =
4π mek
2
B
h 3
(4.9)
A plot with
hν
k B T
as the abscissa and ln
J
T 2
as the ordinate is similar to the graph
shown in Fig. 4.8. The dots represent experimental results, where the photocurrent
under a fixed photon energy is measured as a function of the specimen temperature.
The solid line represents Eq. (4.9) with φ = 0. Therefore, by shifting the line given
by Eq. (4.9) so that it overlaps with the measured plot, i.e., the broken line in Fig. 4.8,
the work function of the specimen φ is obtained from the shift in the lateral direction
(2.6 eV in this case).
4.2 Utilizing Electron Emission Spectroscopy
Because the work function is a potential barrier for electrons, and the excitation of
electrons by providing energy from the outside causes this barrier to be overcome,
resulting in electron emission, measuring either the minimum excitation energy or