

76
4 Measurement of Work Function
Fig. 4.5 Schematic plot of
the relationship between
field strength and field
emission current expressed
by Eq. (4.6)
Inverse of applied voltage V
log(I/V 2
)
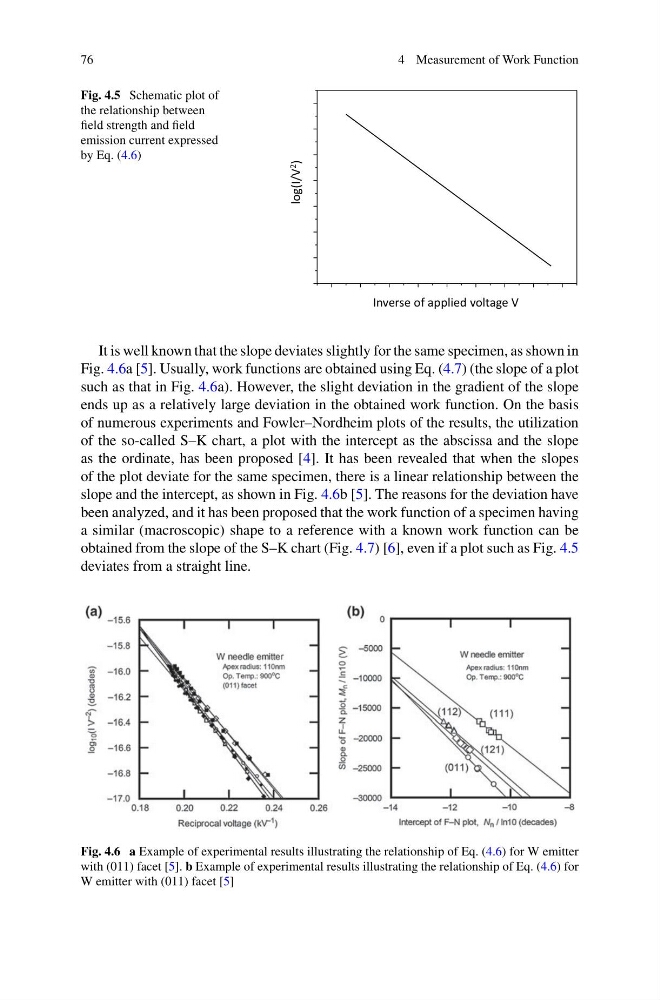
It is well known that the slope deviates slightly for the same specimen, as shown in
Fig. 4.6a [5]. Usually, work functions are obtained using Eq. (4.7) (the slope of a plot
such as that in Fig. 4.6a). However, the slight deviation in the gradient of the slope
ends up as a relatively large deviation in the obtained work function. On the basis
of numerous experiments and Fowler–Nordheim plots of the results, the utilization
of the so-called S–K chart, a plot with the intercept as the abscissa and the slope
as the ordinate, has been proposed [4]. It has been revealed that when the slopes
of the plot deviate for the same specimen, there is a linear relationship between the
slope and the intercept, as shown in Fig. 4.6b [5]. The reasons for the deviation have
been analyzed, and it has been proposed that the work function of a specimen having
a similar (macroscopic) shape to a reference with a known work function can be
obtained from the slope of the S–K chart (Fig. 4.7) [6], even if a plot such as Fig. 4.5
deviates from a straight line.
Fig. 4.6 a Example of experimental results illustrating the relationship of Eq. (4.6) for W emitter
with (011) facet [5]. b Example of experimental results illustrating the relationship of Eq. (4.6) for
W emitter with (011) facet [5]
4 Measurement of Work Function
Fig. 4.5 Schematic plot of
the relationship between
field strength and field
emission current expressed
by Eq. (4.6)
Inverse of applied voltage V
log(I/V 2
)
It is well known that the slope deviates slightly for the same specimen, as shown in
Fig. 4.6a [5]. Usually, work functions are obtained using Eq. (4.7) (the slope of a plot
such as that in Fig. 4.6a). However, the slight deviation in the gradient of the slope
ends up as a relatively large deviation in the obtained work function. On the basis
of numerous experiments and Fowler–Nordheim plots of the results, the utilization
of the so-called S–K chart, a plot with the intercept as the abscissa and the slope
as the ordinate, has been proposed [4]. It has been revealed that when the slopes
of the plot deviate for the same specimen, there is a linear relationship between the
slope and the intercept, as shown in Fig. 4.6b [5]. The reasons for the deviation have
been analyzed, and it has been proposed that the work function of a specimen having
a similar (macroscopic) shape to a reference with a known work function can be
obtained from the slope of the S–K chart (Fig. 4.7) [6], even if a plot such as Fig. 4.5
deviates from a straight line.
Fig. 4.6 a Example of experimental results illustrating the relationship of Eq. (4.6) for W emitter
with (011) facet [5]. b Example of experimental results illustrating the relationship of Eq. (4.6) for
W emitter with (011) facet [5]