

3 Percolation Toward Lateral Junctions
61
-2
0
2
4
6
8
10
12
14
16
-0.2
0
0.2
0.4
0.6
0.8
1
1.2
1.4
Current density / mA cm -2
Current / μA
Voltage / V
-3
-2
-1
1
0
B
C
D
E
A
0
0.1
0.2
0.3
0.4
0.5
0
5 0
1 0 0
Current / μA
Inter-electrode distance (L) / μm
E
D
C
B
A
(a)
(b)
1.0
h +
NTCDA single crystal
1
e -
30 μm
h +
NTCDA single crystal
e -
h +
NTCDA single crystal
e -
2
3
50 μm
100 μm
L e > L
L e < L
L e
(c)
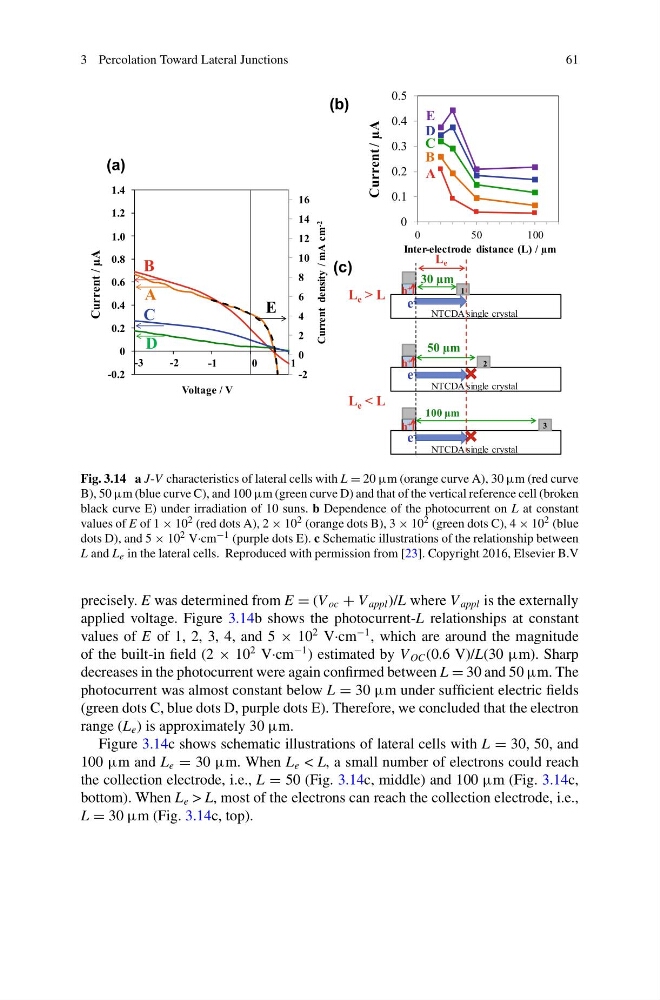
Fig. 3.14 a J-V characteristics of lateral cells with L = 20 μm (orange curve A), 30 μm (red curve
B), 50 μm (blue curve C), and 100 μm (green curve D) and that of the vertical reference cell (broken
black curve E) under irradiation of 10 suns. b Dependence of the photocurrent on L at constant
values of E of 1 × 10 2 (red dots A), 2 × 10 2 (orange dots B), 3 × 10 2 (green dots C), 4 × 10 2 (blue
dots D), and 5 × 10 2 V·cm −1 (purple dots E). c Schematic illustrations of the relationship between
L and L e in the lateral cells. Reproduced with permission from [23]. Copyright 2016, Elsevier B.V
precisely. E was determined from E = (V oc + V appl )/L where V appl is the externally
applied voltage. Figure 3.14b shows the photocurrent-L relationships at constant
values of E of 1, 2, 3, 4, and 5 × 10
2 V·cm
−1 , which are around the magnitude
of the built-in field (2 × 10
2 V·cm
−1 ) estimated by V OC (0.6 V)/L(30 μm). Sharp
decreases in the photocurrent were again confirmed between L = 30 and 50 μm. The
photocurrent was almost constant below L = 30 μm under sufficient electric fields
(green dots C, blue dots D, purple dots E). Therefore, we concluded that the electron
range (L e ) is approximately 30 μm.
Figure 3.14c shows schematic illustrations of lateral cells with L = 30, 50, and
100 μm and L e = 30 μm. When L e < L, a small number of electrons could reach
the collection electrode, i.e., L = 50 (Fig. 3.14c, middle) and 100 μm (Fig. 3.14c,
bottom). When L e > L, most of the electrons can reach the collection electrode, i.e.,
L = 30 μm (Fig. 3.14c, top).
61
-2
0
2
4
6
8
10
12
14
16
-0.2
0
0.2
0.4
0.6
0.8
1
1.2
1.4
Current density / mA cm -2
Current / μA
Voltage / V
-3
-2
-1
1
0
B
C
D
E
A
0
0.1
0.2
0.3
0.4
0.5
0
5 0
1 0 0
Current / μA
Inter-electrode distance (L) / μm
E
D
C
B
A
(a)
(b)
1.0
h +
NTCDA single crystal
1
e -
30 μm
h +
NTCDA single crystal
e -
h +
NTCDA single crystal
e -
2
3
50 μm
100 μm
L e > L
L e < L
L e
(c)
Fig. 3.14 a J-V characteristics of lateral cells with L = 20 μm (orange curve A), 30 μm (red curve
B), 50 μm (blue curve C), and 100 μm (green curve D) and that of the vertical reference cell (broken
black curve E) under irradiation of 10 suns. b Dependence of the photocurrent on L at constant
values of E of 1 × 10 2 (red dots A), 2 × 10 2 (orange dots B), 3 × 10 2 (green dots C), 4 × 10 2 (blue
dots D), and 5 × 10 2 V·cm −1 (purple dots E). c Schematic illustrations of the relationship between
L and L e in the lateral cells. Reproduced with permission from [23]. Copyright 2016, Elsevier B.V
precisely. E was determined from E = (V oc + V appl )/L where V appl is the externally
applied voltage. Figure 3.14b shows the photocurrent-L relationships at constant
values of E of 1, 2, 3, 4, and 5 × 10
2 V·cm
−1 , which are around the magnitude
of the built-in field (2 × 10
2 V·cm
−1 ) estimated by V OC (0.6 V)/L(30 μm). Sharp
decreases in the photocurrent were again confirmed between L = 30 and 50 μm. The
photocurrent was almost constant below L = 30 μm under sufficient electric fields
(green dots C, blue dots D, purple dots E). Therefore, we concluded that the electron
range (L e ) is approximately 30 μm.
Figure 3.14c shows schematic illustrations of lateral cells with L = 30, 50, and
100 μm and L e = 30 μm. When L e < L, a small number of electrons could reach
the collection electrode, i.e., L = 50 (Fig. 3.14c, middle) and 100 μm (Fig. 3.14c,
bottom). When L e > L, most of the electrons can reach the collection electrode, i.e.,
L = 30 μm (Fig. 3.14c, top).