

60
M. Hiramoto
-0.2
-0.1
0
0.1
0.2
0.3
0.4
0.5
Current / μA
Voltage / V
(a)
(b)
C
B
A
-1.0
-0.5
0.5
0
0
0.5
1
1.5
2
300
400
500
600
700
800
Absorbance
EQE /%
Wavelength / nm
0.5
1.0
1.5
2.0
2.5
3.0
0
1.0
2.0
B
C
A
1.0
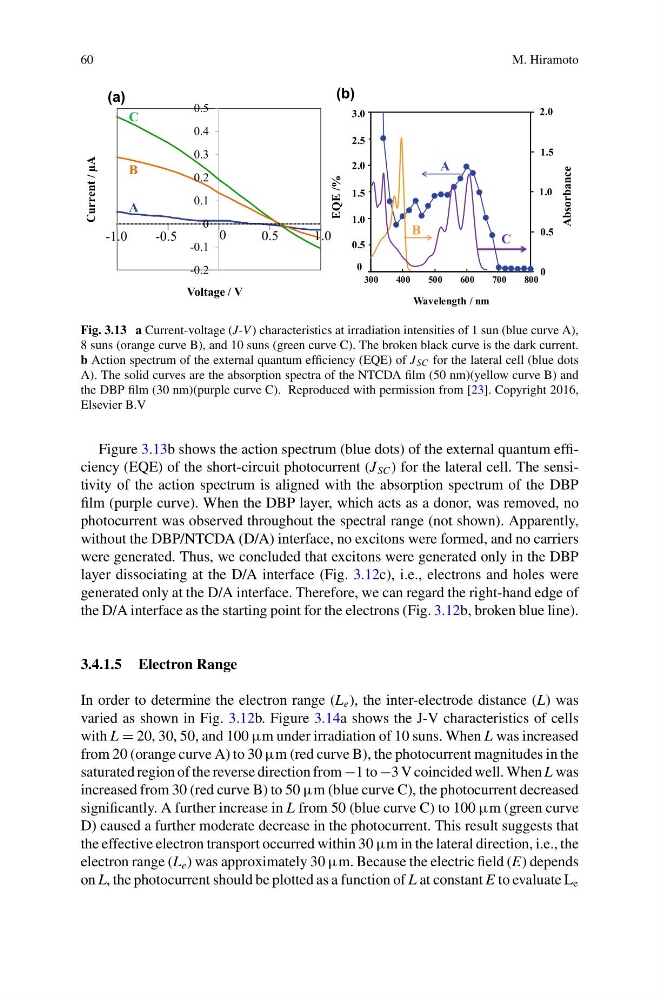
Fig. 3.13 a Current-voltage (J-V ) characteristics at irradiation intensities of 1 sun (blue curve A),
8 suns (orange curve B), and 10 suns (green curve C). The broken black curve is the dark current.
b Action spectrum of the external quantum efficiency (EQE) of J SC for the lateral cell (blue dots
A). The solid curves are the absorption spectra of the NTCDA film (50 nm)(yellow curve B) and
the DBP film (30 nm)(purple curve C). Reproduced with permission from [23]. Copyright 2016,
Elsevier B.V
Figure 3.13b shows the action spectrum (blue dots) of the external quantum efficiency (EQE) of the short-circuit photocurrent (J SC ) for the lateral cell. The sensitivity of the action spectrum is aligned with the absorption spectrum of the DBP
film (purple curve). When the DBP layer, which acts as a donor, was removed, no
photocurrent was observed throughout the spectral range (not shown). Apparently,
without the DBP/NTCDA (D/A) interface, no excitons were formed, and no carriers
were generated. Thus, we concluded that excitons were generated only in the DBP
layer dissociating at the D/A interface (Fig. 3.12c), i.e., electrons and holes were
generated only at the D/A interface. Therefore, we can regard the right-hand edge of
the D/A interface as the starting point for the electrons (Fig. 3.12b, broken blue line).
3.4.1.5 Electron Range
In order to determine the electron range (L e ), the inter-electrode distance (L) was
varied as shown in Fig. 3.12b. Figure 3.14a shows the J-V characteristics of cells
with L = 20, 30, 50, and 100 μm under irradiation of 10 suns. When L was increased
from 20 (orange curve A) to 30 μm (red curve B), the photocurrent magnitudes in the
saturated region of the reverse direction from −1 to −3 V coincided well. When L was
increased from 30 (red curve B) to 50 μm (blue curve C), the photocurrent decreased
significantly. A further increase in L from 50 (blue curve C) to 100 μm (green curve
D) caused a further moderate decrease in the photocurrent. This result suggests that
the effective electron transport occurred within 30 μm in the lateral direction, i.e., the
electron range (L e ) was approximately 30 μm. Because the electric field (E) depends
on L, the photocurrent should be plotted as a function of L at constant E to evaluate L e
M. Hiramoto
-0.2
-0.1
0
0.1
0.2
0.3
0.4
0.5
Current / μA
Voltage / V
(a)
(b)
C
B
A
-1.0
-0.5
0.5
0
0
0.5
1
1.5
2
300
400
500
600
700
800
Absorbance
EQE /%
Wavelength / nm
0.5
1.0
1.5
2.0
2.5
3.0
0
1.0
2.0
B
C
A
1.0
Fig. 3.13 a Current-voltage (J-V ) characteristics at irradiation intensities of 1 sun (blue curve A),
8 suns (orange curve B), and 10 suns (green curve C). The broken black curve is the dark current.
b Action spectrum of the external quantum efficiency (EQE) of J SC for the lateral cell (blue dots
A). The solid curves are the absorption spectra of the NTCDA film (50 nm)(yellow curve B) and
the DBP film (30 nm)(purple curve C). Reproduced with permission from [23]. Copyright 2016,
Elsevier B.V
Figure 3.13b shows the action spectrum (blue dots) of the external quantum efficiency (EQE) of the short-circuit photocurrent (J SC ) for the lateral cell. The sensitivity of the action spectrum is aligned with the absorption spectrum of the DBP
film (purple curve). When the DBP layer, which acts as a donor, was removed, no
photocurrent was observed throughout the spectral range (not shown). Apparently,
without the DBP/NTCDA (D/A) interface, no excitons were formed, and no carriers
were generated. Thus, we concluded that excitons were generated only in the DBP
layer dissociating at the D/A interface (Fig. 3.12c), i.e., electrons and holes were
generated only at the D/A interface. Therefore, we can regard the right-hand edge of
the D/A interface as the starting point for the electrons (Fig. 3.12b, broken blue line).
3.4.1.5 Electron Range
In order to determine the electron range (L e ), the inter-electrode distance (L) was
varied as shown in Fig. 3.12b. Figure 3.14a shows the J-V characteristics of cells
with L = 20, 30, 50, and 100 μm under irradiation of 10 suns. When L was increased
from 20 (orange curve A) to 30 μm (red curve B), the photocurrent magnitudes in the
saturated region of the reverse direction from −1 to −3 V coincided well. When L was
increased from 30 (red curve B) to 50 μm (blue curve C), the photocurrent decreased
significantly. A further increase in L from 50 (blue curve C) to 100 μm (green curve
D) caused a further moderate decrease in the photocurrent. This result suggests that
the effective electron transport occurred within 30 μm in the lateral direction, i.e., the
electron range (L e ) was approximately 30 μm. Because the electric field (E) depends
on L, the photocurrent should be plotted as a function of L at constant E to evaluate L e