

174
T. Fujita
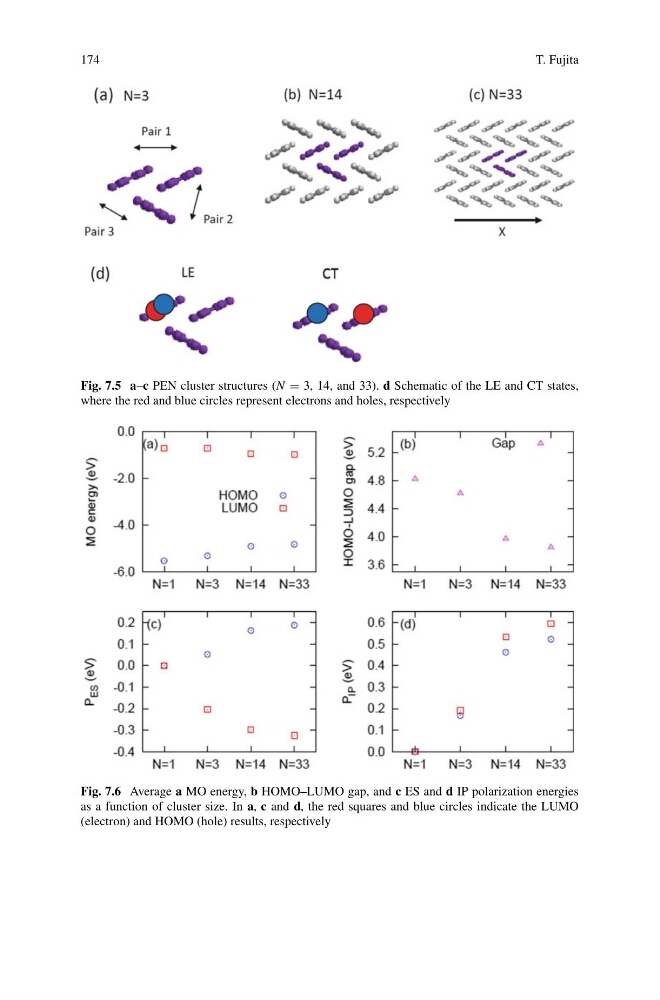
Fig. 7.5 a–c PEN cluster structures (N = 3, 14, and 33). d Schematic of the LE and CT states,
where the red and blue circles represent electrons and holes, respectively
Fig. 7.6 Average a MO energy, b HOMO–LUMO gap, and c ES and d IP polarization energies
as a function of cluster size. In a, c and d, the red squares and blue circles indicate the LUMO
(electron) and HOMO (hole) results, respectively
T. Fujita
Fig. 7.5 a–c PEN cluster structures (N = 3, 14, and 33). d Schematic of the LE and CT states,
where the red and blue circles represent electrons and holes, respectively
Fig. 7.6 Average a MO energy, b HOMO–LUMO gap, and c ES and d IP polarization energies
as a function of cluster size. In a, c and d, the red squares and blue circles indicate the LUMO
(electron) and HOMO (hole) results, respectively