

6 Charge Carrier Dynamics in Polymer Solar Cells
147
TPV/TPC measurements are a useful method for estimating charge carrier lifetime
under device operation conditions.
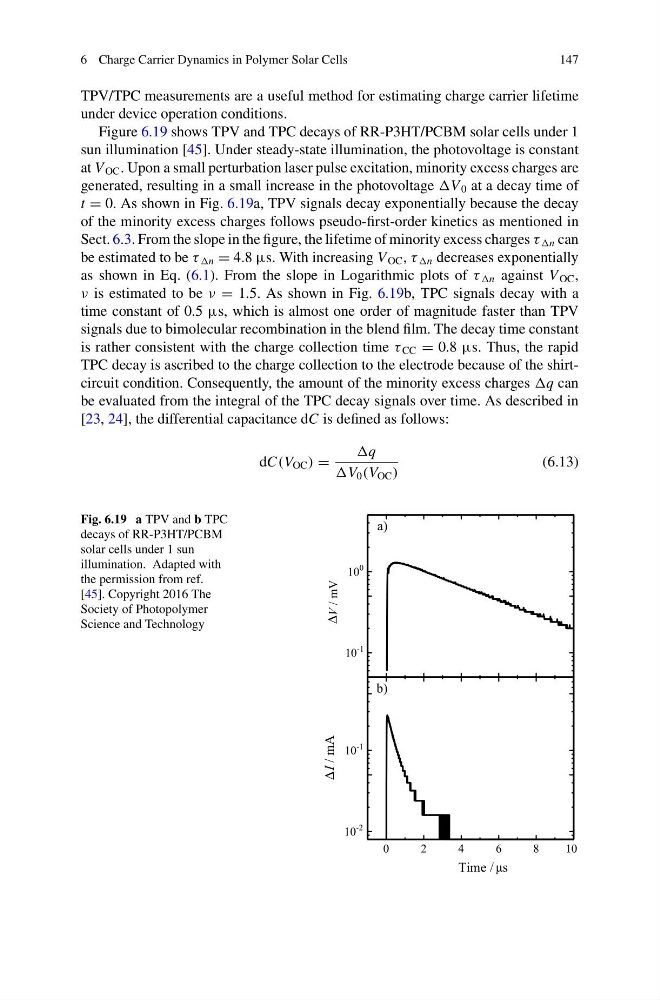
Figure 6.19 shows TPV and TPC decays of RR-P3HT/PCBM solar cells under 1
sun illumination [45]. Under steady-state illumination, the photovoltage is constant
at V OC . Upon a small perturbation laser pulse excitation, minority excess charges are
generated, resulting in a small increase in the photovoltage V 0 at a decay time of
t = 0. As shown in Fig. 6.19a, TPV signals decay exponentially because the decay
of the minority excess charges follows pseudo-first-order kinetics as mentioned in
Sect. 6.3. From the slope in the figure, the lifetime of minority excess charges τ n can
be estimated to be τ n = 4.8 μs. With increasing V OC , τ n decreases exponentially
as shown in Eq. (6.1). From the slope in Logarithmic plots of τ n against V OC ,
ν is estimated to be ν = 1.5. As shown in Fig. 6.19b, TPC signals decay with a
time constant of 0.5 μs, which is almost one order of magnitude faster than TPV
signals due to bimolecular recombination in the blend film. The decay time constant
is rather consistent with the charge collection time τ CC = 0.8 μs. Thus, the rapid
TPC decay is ascribed to the charge collection to the electrode because of the shirtcircuit condition. Consequently, the amount of the minority excess charges q can
be evaluated from the integral of the TPC decay signals over time. As described in
[23, 24], the differential capacitance dC is defined as follows:
dC(V OC ) =
q
V 0 (V OC )
(6.13)
Fig. 6.19 a TPV and b TPC
decays of RR-P3HT/PCBM
solar cells under 1 sun
illumination. Adapted with
the permission from ref.
[45]. Copyright 2016 The
Society of Photopolymer
Science and Technology
10
-1
10
0
V / mV
a)
0
2
4
6
8
10
10
-2
10
-1
I / mA
Time / μs
b)
Δ
Δ
147
TPV/TPC measurements are a useful method for estimating charge carrier lifetime
under device operation conditions.
Figure 6.19 shows TPV and TPC decays of RR-P3HT/PCBM solar cells under 1
sun illumination [45]. Under steady-state illumination, the photovoltage is constant
at V OC . Upon a small perturbation laser pulse excitation, minority excess charges are
generated, resulting in a small increase in the photovoltage V 0 at a decay time of
t = 0. As shown in Fig. 6.19a, TPV signals decay exponentially because the decay
of the minority excess charges follows pseudo-first-order kinetics as mentioned in
Sect. 6.3. From the slope in the figure, the lifetime of minority excess charges τ n can
be estimated to be τ n = 4.8 μs. With increasing V OC , τ n decreases exponentially
as shown in Eq. (6.1). From the slope in Logarithmic plots of τ n against V OC ,
ν is estimated to be ν = 1.5. As shown in Fig. 6.19b, TPC signals decay with a
time constant of 0.5 μs, which is almost one order of magnitude faster than TPV
signals due to bimolecular recombination in the blend film. The decay time constant
is rather consistent with the charge collection time τ CC = 0.8 μs. Thus, the rapid
TPC decay is ascribed to the charge collection to the electrode because of the shirtcircuit condition. Consequently, the amount of the minority excess charges q can
be evaluated from the integral of the TPC decay signals over time. As described in
[23, 24], the differential capacitance dC is defined as follows:
dC(V OC ) =
q
V 0 (V OC )
(6.13)
Fig. 6.19 a TPV and b TPC
decays of RR-P3HT/PCBM
solar cells under 1 sun
illumination. Adapted with
the permission from ref.
[45]. Copyright 2016 The
Society of Photopolymer
Science and Technology
10
-1
10
0
V / mV
a)
0
2
4
6
8
10
10
-2
10
-1
I / mA
Time / μs
b)
Δ
Δ