

6 Charge Carrier Dynamics in Polymer Solar Cells
145
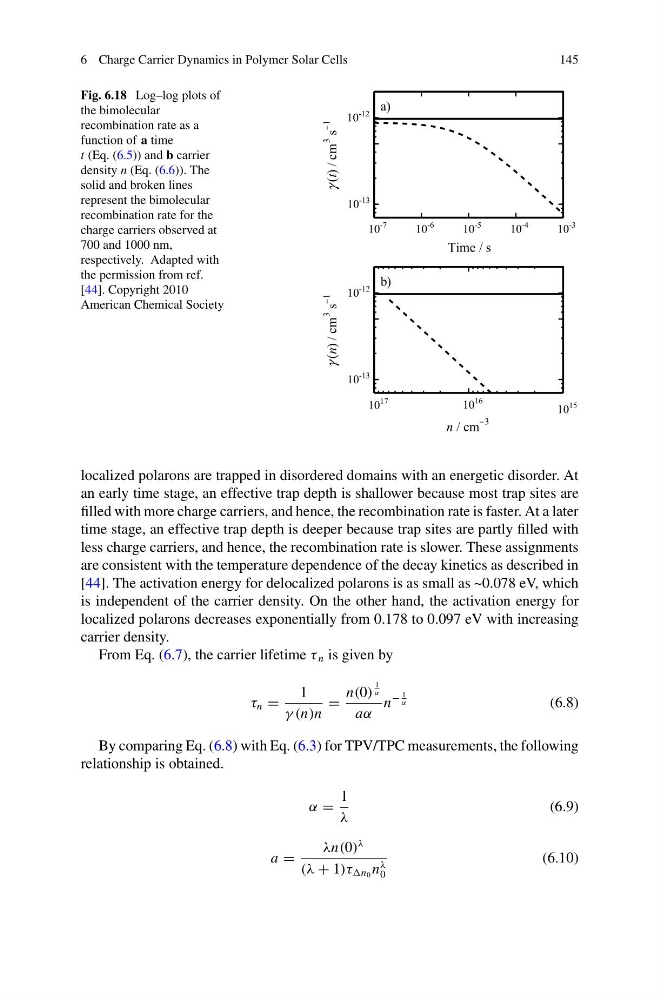
Fig. 6.18 Log–log plots of
the bimolecular
recombination rate as a
function of a time
t (Eq. (6.5)) and b carrier
density n (Eq. (6.6)). The
solid and broken lines
represent the bimolecular
recombination rate for the
charge carriers observed at
700 and 1000 nm,
respectively. Adapted with
the permission from ref.
[44]. Copyright 2010
American Chemical Society
10
-7
10
-6
10
-5
10
-4
10
-3
10
-13
10
-12
γ (t) / cm
3
s
–1
Time / s
a)
10
15
10
16
10
17
10
-13
10
-12
γ (n) / cm
3
s
–1
n / cm
–3
b)
localized polarons are trapped in disordered domains with an energetic disorder. At
an early time stage, an effective trap depth is shallower because most trap sites are
filled with more charge carriers, and hence, the recombination rate is faster. At a later
time stage, an effective trap depth is deeper because trap sites are partly filled with
less charge carriers, and hence, the recombination rate is slower. These assignments
are consistent with the temperature dependence of the decay kinetics as described in
[44]. The activation energy for delocalized polarons is as small as ~0.078 eV, which
is independent of the carrier density. On the other hand, the activation energy for
localized polarons decreases exponentially from 0.178 to 0.097 eV with increasing
carrier density.
From Eq. (6.7), the carrier lifetime τ n is given by
τ n =
1
γ (n)n
=
n(0)
1
α
aα
n
−
1
α
(6.8)
By comparing Eq. (6.8) with Eq. (6.3) for TPV/TPC measurements, the following
relationship is obtained.
α =
1
λ
(6.9)
a =
λn(0)
λ
(λ + 1)τ n 0 n
λ
0
(6.10)
145
Fig. 6.18 Log–log plots of
the bimolecular
recombination rate as a
function of a time
t (Eq. (6.5)) and b carrier
density n (Eq. (6.6)). The
solid and broken lines
represent the bimolecular
recombination rate for the
charge carriers observed at
700 and 1000 nm,
respectively. Adapted with
the permission from ref.
[44]. Copyright 2010
American Chemical Society
10
-7
10
-6
10
-5
10
-4
10
-3
10
-13
10
-12
γ (t) / cm
3
s
–1
Time / s
a)
10
15
10
16
10
17
10
-13
10
-12
γ (n) / cm
3
s
–1
n / cm
–3
b)
localized polarons are trapped in disordered domains with an energetic disorder. At
an early time stage, an effective trap depth is shallower because most trap sites are
filled with more charge carriers, and hence, the recombination rate is faster. At a later
time stage, an effective trap depth is deeper because trap sites are partly filled with
less charge carriers, and hence, the recombination rate is slower. These assignments
are consistent with the temperature dependence of the decay kinetics as described in
[44]. The activation energy for delocalized polarons is as small as ~0.078 eV, which
is independent of the carrier density. On the other hand, the activation energy for
localized polarons decreases exponentially from 0.178 to 0.097 eV with increasing
carrier density.
From Eq. (6.7), the carrier lifetime τ n is given by
τ n =
1
γ (n)n
=
n(0)
1
α
aα
n
−
1
α
(6.8)
By comparing Eq. (6.8) with Eq. (6.3) for TPV/TPC measurements, the following
relationship is obtained.
α =
1
λ
(6.9)
a =
λn(0)
λ
(λ + 1)τ n 0 n
λ
0
(6.10)