

6 Charge Carrier Dynamics in Polymer Solar Cells
137
dissociation in crystalline polymer solar cells like RR-P3HT/PCBM. The charge
dissociation efficiency in other crystalline polymer solar cells will be discussed in
Sect. 6.6.
6.4.3 Polymer Solar Cells with Small Photon Energy Loss
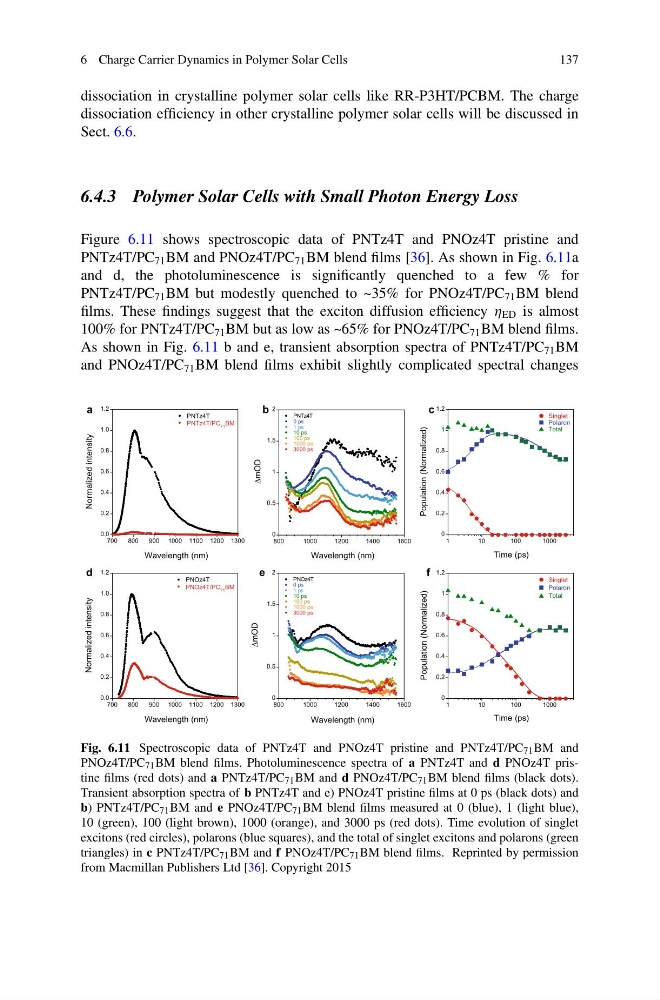
Figure 6.11 shows spectroscopic data of PNTz4T and PNOz4T pristine and
PNTz4T/PC 71 BM and PNOz4T/PC 71 BM blend films [36]. As shown in Fig. 6.11a
and d, the photoluminescence is significantly quenched to a few % for
PNTz4T/PC 71 BM but modestly quenched to ~35% for PNOz4T/PC 71 BM blend
films. These findings suggest that the exciton diffusion efficiency η ED is almost
100% for PNTz4T/PC 71 BM but as low as ~65% for PNOz4T/PC 71 BM blend films.
As shown in Fig. 6.11 b and e, transient absorption spectra of PNTz4T/PC 71 BM
and PNOz4T/PC 71 BM blend films exhibit slightly complicated spectral changes
0
0.2
0.4
0.6
0.8
1
1.2
1
1 0
1 0 0
1 0 0 0
Singlet
Polaron
Total
Time (ps)
Population (Normalized)
0
0.5
1
1.5
2
800
1000
1200
1400
1600
PNOz4T
0 ps
1 ps
10 ps
100 ps
1000 ps
3000 ps
Wavelength (nm)
ΔmOD
0.0
0.2
0.4
0.6
0.8
1.0
1.2
700
800
900 1000 1100 1200 1300
PNOz4T
PNOz4T/PC 71 BM
Wavelength (nm)
Normalized intensity
0
0.5
1
1.5
2
800
1000
1200
1400
1600
PNTz4T
0 ps
1 ps
10 ps
100 ps
1000 ps
3000 ps
Wavelength (nm)
ΔmOD
0.0
0.2
0.4
0.6
0.8
1.0
1.2
700
800
900 1000 1100 1200 1300
PNTz4T
PNTz4T/PC 71 BM
Normalized
intensity
Wavelength (nm)
0
0.2
0.4
0.6
0.8
1
1.2
1
1 0
1 0 0
1 0 0 0
Singlet
Polaron
Total
Time (ps)
Population (Normalized)
a
b
d
c
e
f
Fig. 6.11 Spectroscopic data of PNTz4T and PNOz4T pristine and PNTz4T/PC 71 BM and
PNOz4T/PC 71 BM blend films. Photoluminescence spectra of a PNTz4T and d PNOz4T pristine films (red dots) and a PNTz4T/PC 71 BM and d PNOz4T/PC 71 BM blend films (black dots).
Transient absorption spectra of b PNTz4T and e) PNOz4T pristine films at 0 ps (black dots) and
b) PNTz4T/PC 71 BM and e PNOz4T/PC 71 BM blend films measured at 0 (blue), 1 (light blue),
10 (green), 100 (light brown), 1000 (orange), and 3000 ps (red dots). Time evolution of singlet
excitons (red circles), polarons (blue squares), and the total of singlet excitons and polarons (green
triangles) in c PNTz4T/PC 71 BM and f PNOz4T/PC 71 BM blend films. Reprinted by permission
from Macmillan Publishers Ltd [36]. Copyright 2015
137
dissociation in crystalline polymer solar cells like RR-P3HT/PCBM. The charge
dissociation efficiency in other crystalline polymer solar cells will be discussed in
Sect. 6.6.
6.4.3 Polymer Solar Cells with Small Photon Energy Loss
Figure 6.11 shows spectroscopic data of PNTz4T and PNOz4T pristine and
PNTz4T/PC 71 BM and PNOz4T/PC 71 BM blend films [36]. As shown in Fig. 6.11a
and d, the photoluminescence is significantly quenched to a few % for
PNTz4T/PC 71 BM but modestly quenched to ~35% for PNOz4T/PC 71 BM blend
films. These findings suggest that the exciton diffusion efficiency η ED is almost
100% for PNTz4T/PC 71 BM but as low as ~65% for PNOz4T/PC 71 BM blend films.
As shown in Fig. 6.11 b and e, transient absorption spectra of PNTz4T/PC 71 BM
and PNOz4T/PC 71 BM blend films exhibit slightly complicated spectral changes
0
0.2
0.4
0.6
0.8
1
1.2
1
1 0
1 0 0
1 0 0 0
Singlet
Polaron
Total
Time (ps)
Population (Normalized)
0
0.5
1
1.5
2
800
1000
1200
1400
1600
PNOz4T
0 ps
1 ps
10 ps
100 ps
1000 ps
3000 ps
Wavelength (nm)
ΔmOD
0.0
0.2
0.4
0.6
0.8
1.0
1.2
700
800
900 1000 1100 1200 1300
PNOz4T
PNOz4T/PC 71 BM
Wavelength (nm)
Normalized intensity
0
0.5
1
1.5
2
800
1000
1200
1400
1600
PNTz4T
0 ps
1 ps
10 ps
100 ps
1000 ps
3000 ps
Wavelength (nm)
ΔmOD
0.0
0.2
0.4
0.6
0.8
1.0
1.2
700
800
900 1000 1100 1200 1300
PNTz4T
PNTz4T/PC 71 BM
Normalized
intensity
Wavelength (nm)
0
0.2
0.4
0.6
0.8
1
1.2
1
1 0
1 0 0
1 0 0 0
Singlet
Polaron
Total
Time (ps)
Population (Normalized)
a
b
d
c
e
f
Fig. 6.11 Spectroscopic data of PNTz4T and PNOz4T pristine and PNTz4T/PC 71 BM and
PNOz4T/PC 71 BM blend films. Photoluminescence spectra of a PNTz4T and d PNOz4T pristine films (red dots) and a PNTz4T/PC 71 BM and d PNOz4T/PC 71 BM blend films (black dots).
Transient absorption spectra of b PNTz4T and e) PNOz4T pristine films at 0 ps (black dots) and
b) PNTz4T/PC 71 BM and e PNOz4T/PC 71 BM blend films measured at 0 (blue), 1 (light blue),
10 (green), 100 (light brown), 1000 (orange), and 3000 ps (red dots). Time evolution of singlet
excitons (red circles), polarons (blue squares), and the total of singlet excitons and polarons (green
triangles) in c PNTz4T/PC 71 BM and f PNOz4T/PC 71 BM blend films. Reprinted by permission
from Macmillan Publishers Ltd [36]. Copyright 2015