

Introduction
9
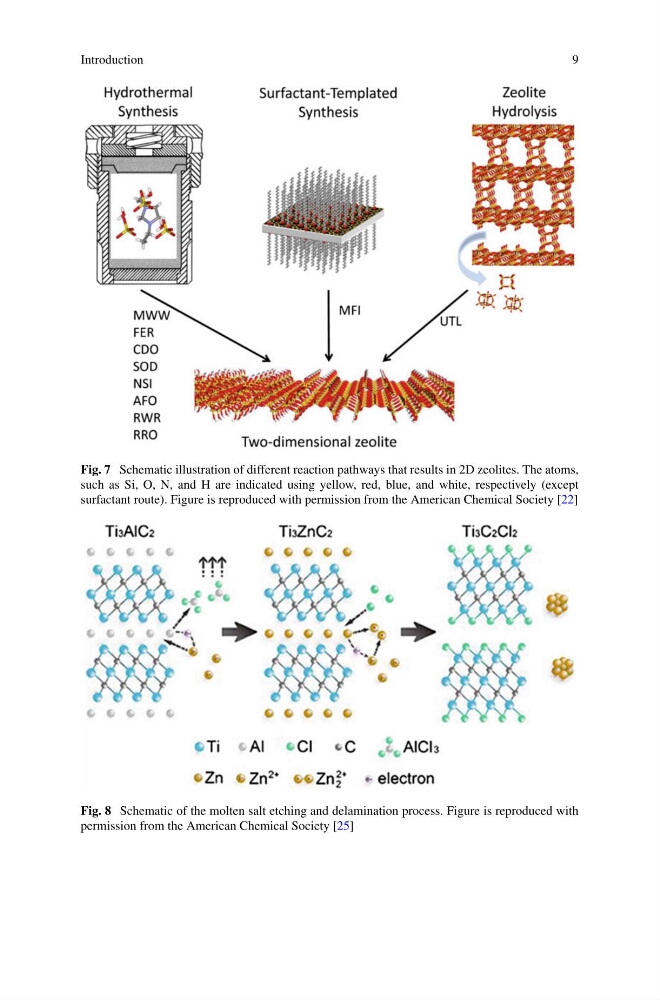
Fig. 7 Schematic illustration of different reaction pathways that results in 2D zeolites. The atoms,
such as Si, O, N, and H are indicated using yellow, red, blue, and white, respectively (except
surfactant route). Figure is reproduced with permission from the American Chemical Society [22]
Fig. 8 Schematic of the molten salt etching and delamination process. Figure is reproduced with
permission from the American Chemical Society [25]
9
Fig. 7 Schematic illustration of different reaction pathways that results in 2D zeolites. The atoms,
such as Si, O, N, and H are indicated using yellow, red, blue, and white, respectively (except
surfactant route). Figure is reproduced with permission from the American Chemical Society [22]
Fig. 8 Schematic of the molten salt etching and delamination process. Figure is reproduced with
permission from the American Chemical Society [25]