

120
S. Pakdel et al.
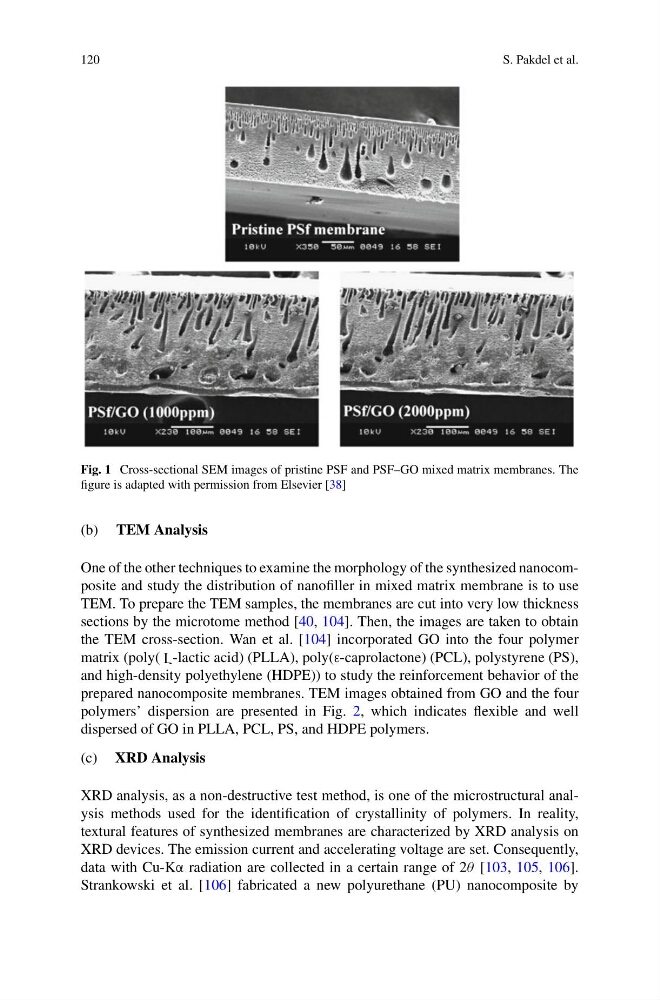
Fig. 1 Cross-sectional SEM images of pristine PSF and PSF–GO mixed matrix membranes. The
figure is adapted with permission from Elsevier [38]
(b) TEM Analysis
One of the other techniques to examine the morphology of the synthesized nanocomposite and study the distribution of nanofiller in mixed matrix membrane is to use
TEM. To prepare the TEM samples, the membranes are cut into very low thickness
sections by the microtome method [40, 104]. Then, the images are taken to obtain
the TEM cross-section. Wan et al. [104] incorporated GO into the four polymer
matrix (poly( -lactic acid) (PLLA), poly(ε-caprolactone) (PCL), polystyrene (PS),
and high-density polyethylene (HDPE)) to study the reinforcement behavior of the
prepared nanocomposite membranes. TEM images obtained from GO and the four
polymers’ dispersion are presented in Fig. 2, which indicates flexible and well
dispersed of GO in PLLA, PCL, PS, and HDPE polymers.
(c) XRD Analysis
XRD analysis, as a non-destructive test method, is one of the microstructural analysis methods used for the identification of crystallinity of polymers. In reality,
textural features of synthesized membranes are characterized by XRD analysis on
XRD devices. The emission current and accelerating voltage are set. Consequently,
data with Cu-Kα radiation are collected in a certain range of 2θ [103, 105, 106].
Strankowski et al. [106] fabricated a new polyurethane (PU) nanocomposite by
S. Pakdel et al.
Fig. 1 Cross-sectional SEM images of pristine PSF and PSF–GO mixed matrix membranes. The
figure is adapted with permission from Elsevier [38]
(b) TEM Analysis
One of the other techniques to examine the morphology of the synthesized nanocomposite and study the distribution of nanofiller in mixed matrix membrane is to use
TEM. To prepare the TEM samples, the membranes are cut into very low thickness
sections by the microtome method [40, 104]. Then, the images are taken to obtain
the TEM cross-section. Wan et al. [104] incorporated GO into the four polymer
matrix (poly( -lactic acid) (PLLA), poly(ε-caprolactone) (PCL), polystyrene (PS),
and high-density polyethylene (HDPE)) to study the reinforcement behavior of the
prepared nanocomposite membranes. TEM images obtained from GO and the four
polymers’ dispersion are presented in Fig. 2, which indicates flexible and well
dispersed of GO in PLLA, PCL, PS, and HDPE polymers.
(c) XRD Analysis
XRD analysis, as a non-destructive test method, is one of the microstructural analysis methods used for the identification of crystallinity of polymers. In reality,
textural features of synthesized membranes are characterized by XRD analysis on
XRD devices. The emission current and accelerating voltage are set. Consequently,
data with Cu-Kα radiation are collected in a certain range of 2θ [103, 105, 106].
Strankowski et al. [106] fabricated a new polyurethane (PU) nanocomposite by