

2 Subcriticality
29
If the accelerator had higher energy proton beam than 100 MeV, the factor would be
larger [20].
2.2 Power Spectral Analyses
2.2.1 Experimental Settings
The power spectral analysis on frequency domain is carried out in the same A-core
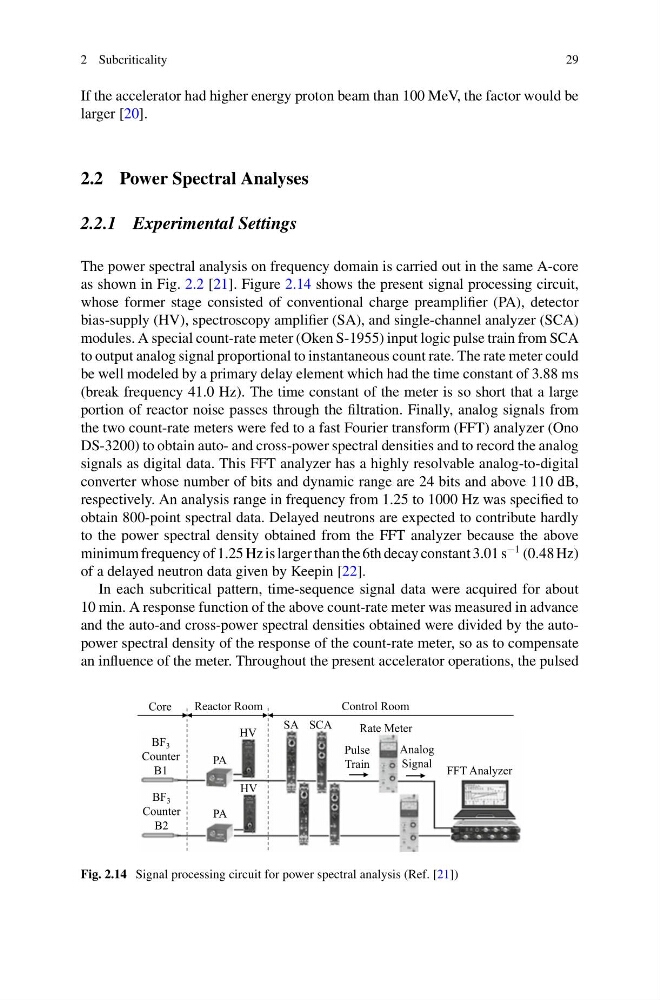
as shown in Fig. 2.2 [21]. Figure 2.14 shows the present signal processing circuit,
whose former stage consisted of conventional charge preamplifier (PA), detector
bias-supply (HV), spectroscopy amplifier (SA), and single-channel analyzer (SCA)
modules. A special count-rate meter (Oken S-1955) input logic pulse train from SCA
to output analog signal proportional to instantaneous count rate. The rate meter could
be well modeled by a primary delay element which had the time constant of 3.88 ms
(break frequency 41.0 Hz). The time constant of the meter is so short that a large
portion of reactor noise passes through the filtration. Finally, analog signals from
the two count-rate meters were fed to a fast Fourier transform (FFT) analyzer (Ono
DS-3200) to obtain auto- and cross-power spectral densities and to record the analog
signals as digital data. This FFT analyzer has a highly resolvable analog-to-digital
converter whose number of bits and dynamic range are 24 bits and above 110 dB,
respectively. An analysis range in frequency from 1.25 to 1000 Hz was specified to
obtain 800-point spectral data. Delayed neutrons are expected to contribute hardly
to the power spectral density obtained from the FFT analyzer because the above
minimum frequency of 1.25 Hz is larger than the 6th decay constant 3.01 s
−1 (0.48 Hz)
of a delayed neutron data given by Keepin [22].
In each subcritical pattern, time-sequence signal data were acquired for about
10 min. A response function of the above count-rate meter was measured in advance
and the auto-and cross-power spectral densities obtained were divided by the autopower spectral density of the response of the count-rate meter, so as to compensate
an influence of the meter. Throughout the present accelerator operations, the pulsed
Core
Reactor Room
Control Room
BF 3
Counter
B1
BF 3
Counter
B2
PA
PA
HV
HV
SA SCA
Rate Meter
FFT Analyzer
Pulse
Train
Analog
Signal
Fig. 2.14 Signal processing circuit for power spectral analysis (Ref. [21])
29
If the accelerator had higher energy proton beam than 100 MeV, the factor would be
larger [20].
2.2 Power Spectral Analyses
2.2.1 Experimental Settings
The power spectral analysis on frequency domain is carried out in the same A-core
as shown in Fig. 2.2 [21]. Figure 2.14 shows the present signal processing circuit,
whose former stage consisted of conventional charge preamplifier (PA), detector
bias-supply (HV), spectroscopy amplifier (SA), and single-channel analyzer (SCA)
modules. A special count-rate meter (Oken S-1955) input logic pulse train from SCA
to output analog signal proportional to instantaneous count rate. The rate meter could
be well modeled by a primary delay element which had the time constant of 3.88 ms
(break frequency 41.0 Hz). The time constant of the meter is so short that a large
portion of reactor noise passes through the filtration. Finally, analog signals from
the two count-rate meters were fed to a fast Fourier transform (FFT) analyzer (Ono
DS-3200) to obtain auto- and cross-power spectral densities and to record the analog
signals as digital data. This FFT analyzer has a highly resolvable analog-to-digital
converter whose number of bits and dynamic range are 24 bits and above 110 dB,
respectively. An analysis range in frequency from 1.25 to 1000 Hz was specified to
obtain 800-point spectral data. Delayed neutrons are expected to contribute hardly
to the power spectral density obtained from the FFT analyzer because the above
minimum frequency of 1.25 Hz is larger than the 6th decay constant 3.01 s
−1 (0.48 Hz)
of a delayed neutron data given by Keepin [22].
In each subcritical pattern, time-sequence signal data were acquired for about
10 min. A response function of the above count-rate meter was measured in advance
and the auto-and cross-power spectral densities obtained were divided by the autopower spectral density of the response of the count-rate meter, so as to compensate
an influence of the meter. Throughout the present accelerator operations, the pulsed
Core
Reactor Room
Control Room
BF 3
Counter
B1
BF 3
Counter
B2
PA
PA
HV
HV
SA SCA
Rate Meter
FFT Analyzer
Pulse
Train
Analog
Signal
Fig. 2.14 Signal processing circuit for power spectral analysis (Ref. [21])