

2 Subcriticality
23
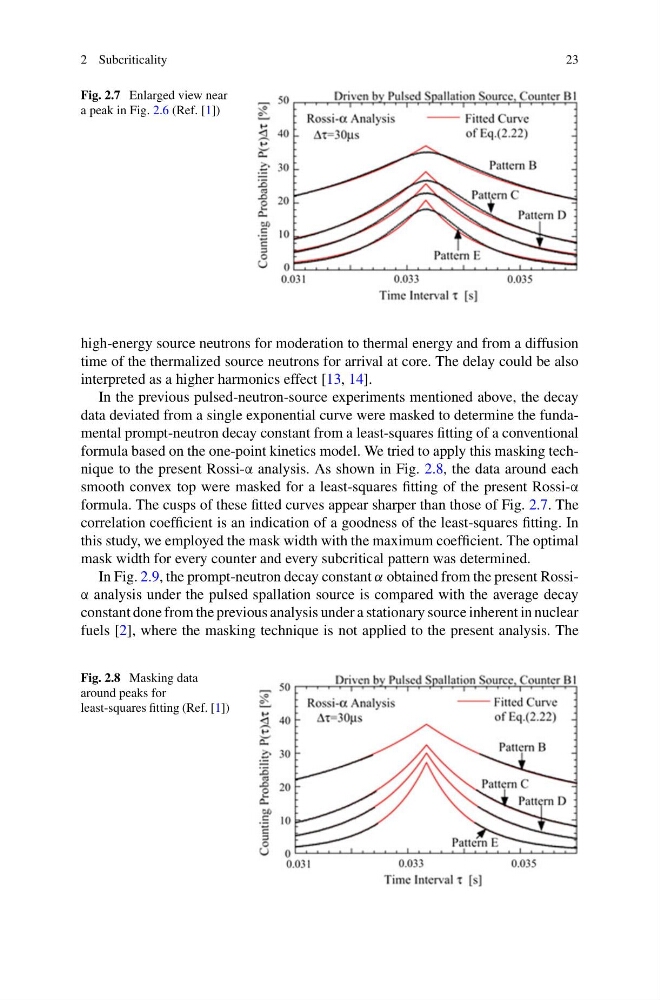
Fig. 2.7 Enlarged view near
a peak in Fig. 2.6 (Ref. [1])
high-energy source neutrons for moderation to thermal energy and from a diffusion
time of the thermalized source neutrons for arrival at core. The delay could be also
interpreted as a higher harmonics effect [13, 14].
In the previous pulsed-neutron-source experiments mentioned above, the decay
data deviated from a single exponential curve were masked to determine the fundamental prompt-neutron decay constant from a least-squares fitting of a conventional
formula based on the one-point kinetics model. We tried to apply this masking technique to the present Rossi-α analysis. As shown in Fig. 2.8, the data around each
smooth convex top were masked for a least-squares fitting of the present Rossi-α
formula. The cusps of these fitted curves appear sharper than those of Fig. 2.7. The
correlation coefficient is an indication of a goodness of the least-squares fitting. In
this study, we employed the mask width with the maximum coefficient. The optimal
mask width for every counter and every subcritical pattern was determined.
In Fig. 2.9, the prompt-neutron decay constant α obtained from the present Rossiα analysis under the pulsed spallation source is compared with the average decay
constant done from the previous analysis under a stationary source inherent in nuclear
fuels [2], where the masking technique is not applied to the present analysis. The
Fig. 2.8 Masking data
around peaks for
least-squares fitting (Ref. [1])
23
Fig. 2.7 Enlarged view near
a peak in Fig. 2.6 (Ref. [1])
high-energy source neutrons for moderation to thermal energy and from a diffusion
time of the thermalized source neutrons for arrival at core. The delay could be also
interpreted as a higher harmonics effect [13, 14].
In the previous pulsed-neutron-source experiments mentioned above, the decay
data deviated from a single exponential curve were masked to determine the fundamental prompt-neutron decay constant from a least-squares fitting of a conventional
formula based on the one-point kinetics model. We tried to apply this masking technique to the present Rossi-α analysis. As shown in Fig. 2.8, the data around each
smooth convex top were masked for a least-squares fitting of the present Rossi-α
formula. The cusps of these fitted curves appear sharper than those of Fig. 2.7. The
correlation coefficient is an indication of a goodness of the least-squares fitting. In
this study, we employed the mask width with the maximum coefficient. The optimal
mask width for every counter and every subcritical pattern was determined.
In Fig. 2.9, the prompt-neutron decay constant α obtained from the present Rossiα analysis under the pulsed spallation source is compared with the average decay
constant done from the previous analysis under a stationary source inherent in nuclear
fuels [2], where the masking technique is not applied to the present analysis. The
Fig. 2.8 Masking data
around peaks for
least-squares fitting (Ref. [1])