

7 Neutronics of Lead and Bismuth
209
7.4.2.2 Cross-Section Adjustment Method
As discussed in Sect. 7.4.2.1, the uncertainty induced by covariance data was
compared with that of sample reactivity obtained by the experiments. In this section,
the effect of decreasing uncertainty induced by the nuclear data was investigated
by the cross-section adjustment method shown in Eqs. (7.30) and (7.31), on calculated reactivity. Here, the uncertainty induced by the analyses was assumed to be
null, in order to estimate the maximum effect of decreasing uncertainty on the calculated reactivity. The cross-section adjustment with U and Pb isotopes was considered
useful analyses in that the effects of covariance data (U and Pb isotopes) were significant, although the covariance data of H, C and Al isotopes could give inadequate
results of the effect on the evaluation of uncertainty.
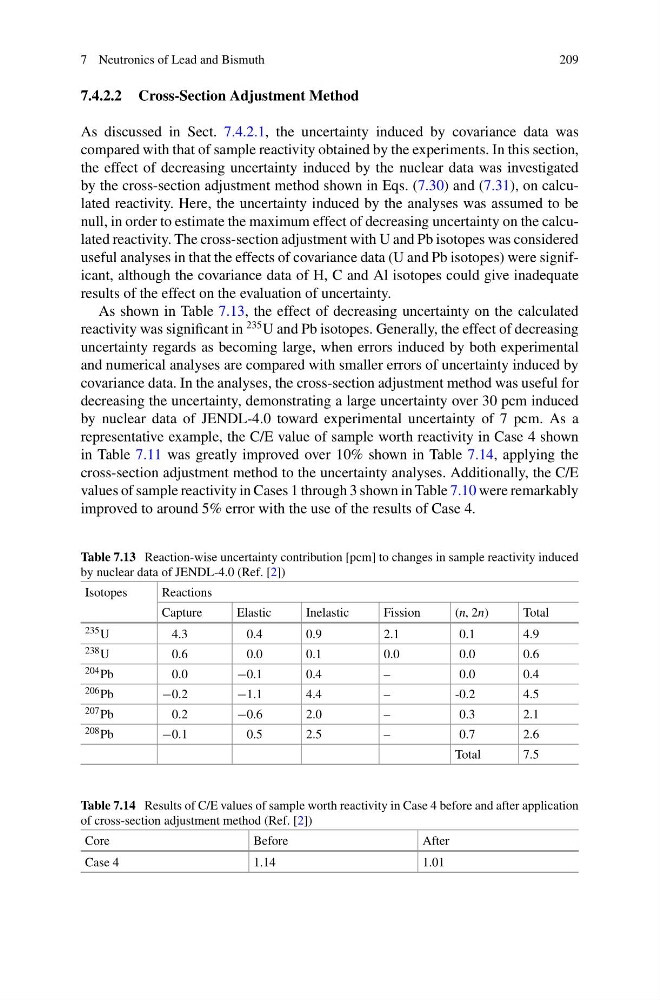
As shown in Table 7.13, the effect of decreasing uncertainty on the calculated
reactivity was significant in
235 U and Pb isotopes. Generally, the effect of decreasing
uncertainty regards as becoming large, when errors induced by both experimental
and numerical analyses are compared with smaller errors of uncertainty induced by
covariance data. In the analyses, the cross-section adjustment method was useful for
decreasing the uncertainty, demonstrating a large uncertainty over 30 pcm induced
by nuclear data of JENDL-4.0 toward experimental uncertainty of 7 pcm. As a
representative example, the C/E value of sample worth reactivity in Case 4 shown
in Table 7.11 was greatly improved over 10% shown in Table 7.14, applying the
cross-section adjustment method to the uncertainty analyses. Additionally, the C/E
values of sample reactivity in Cases 1 through 3 shown in Table 7.10 were remarkably
improved to around 5% error with the use of the results of Case 4.
Table 7.13 Reaction-wise uncertainty contribution [pcm] to changes in sample reactivity induced
by nuclear data of JENDL-4.0 (Ref. [2])
Isotopes
Reactions
Capture
Elastic
Inelastic
Fission
(n, 2n)
Total
235 U
4.3
0.4
0.9
2.1
0.1
4.9
238 U
0.6
0.0
0.1
0.0
0.0
0.6
204 Pb
0.0
−0.1
0.4
–
0.0
0.4
206 Pb
−0.2
−1.1
4.4
–
-0.2
4.5
207 Pb
0.2
−0.6
2.0
–
0.3
2.1
208 Pb
−0.1
0.5
2.5
–
0.7
2.6
Total
7.5
Table 7.14 Results of C/E values of sample worth reactivity in Case 4 before and after application
of cross-section adjustment method (Ref. [2])
Core
Before
After
Case 4
1.14
1.01
209
7.4.2.2 Cross-Section Adjustment Method
As discussed in Sect. 7.4.2.1, the uncertainty induced by covariance data was
compared with that of sample reactivity obtained by the experiments. In this section,
the effect of decreasing uncertainty induced by the nuclear data was investigated
by the cross-section adjustment method shown in Eqs. (7.30) and (7.31), on calculated reactivity. Here, the uncertainty induced by the analyses was assumed to be
null, in order to estimate the maximum effect of decreasing uncertainty on the calculated reactivity. The cross-section adjustment with U and Pb isotopes was considered
useful analyses in that the effects of covariance data (U and Pb isotopes) were significant, although the covariance data of H, C and Al isotopes could give inadequate
results of the effect on the evaluation of uncertainty.
As shown in Table 7.13, the effect of decreasing uncertainty on the calculated
reactivity was significant in
235 U and Pb isotopes. Generally, the effect of decreasing
uncertainty regards as becoming large, when errors induced by both experimental
and numerical analyses are compared with smaller errors of uncertainty induced by
covariance data. In the analyses, the cross-section adjustment method was useful for
decreasing the uncertainty, demonstrating a large uncertainty over 30 pcm induced
by nuclear data of JENDL-4.0 toward experimental uncertainty of 7 pcm. As a
representative example, the C/E value of sample worth reactivity in Case 4 shown
in Table 7.11 was greatly improved over 10% shown in Table 7.14, applying the
cross-section adjustment method to the uncertainty analyses. Additionally, the C/E
values of sample reactivity in Cases 1 through 3 shown in Table 7.10 were remarkably
improved to around 5% error with the use of the results of Case 4.
Table 7.13 Reaction-wise uncertainty contribution [pcm] to changes in sample reactivity induced
by nuclear data of JENDL-4.0 (Ref. [2])
Isotopes
Reactions
Capture
Elastic
Inelastic
Fission
(n, 2n)
Total
235 U
4.3
0.4
0.9
2.1
0.1
4.9
238 U
0.6
0.0
0.1
0.0
0.0
0.6
204 Pb
0.0
−0.1
0.4
–
0.0
0.4
206 Pb
−0.2
−1.1
4.4
–
-0.2
4.5
207 Pb
0.2
−0.6
2.0
–
0.3
2.1
208 Pb
−0.1
0.5
2.5
–
0.7
2.6
Total
7.5
Table 7.14 Results of C/E values of sample worth reactivity in Case 4 before and after application
of cross-section adjustment method (Ref. [2])
Core
Before
After
Case 4
1.14
1.01