

206
C. H. Pyeon
P(T 0 |R 0 ) =P(R 0 |T 0 ) ·
P(T 0 )
P(R 0 )
=(const.) · exp
(−J )
exp
−(R e − R c (T 0 )) t (V e + V m ) −1 (R e − R c (T 0 ))
2
,
(7.27)
J =(T − T 0 )
t M
−1
(T − T 0 )+(R e − R c (T 0 ))
t
(V e + V m )
−1
(R e − R c (T 0 )).
(7.28)
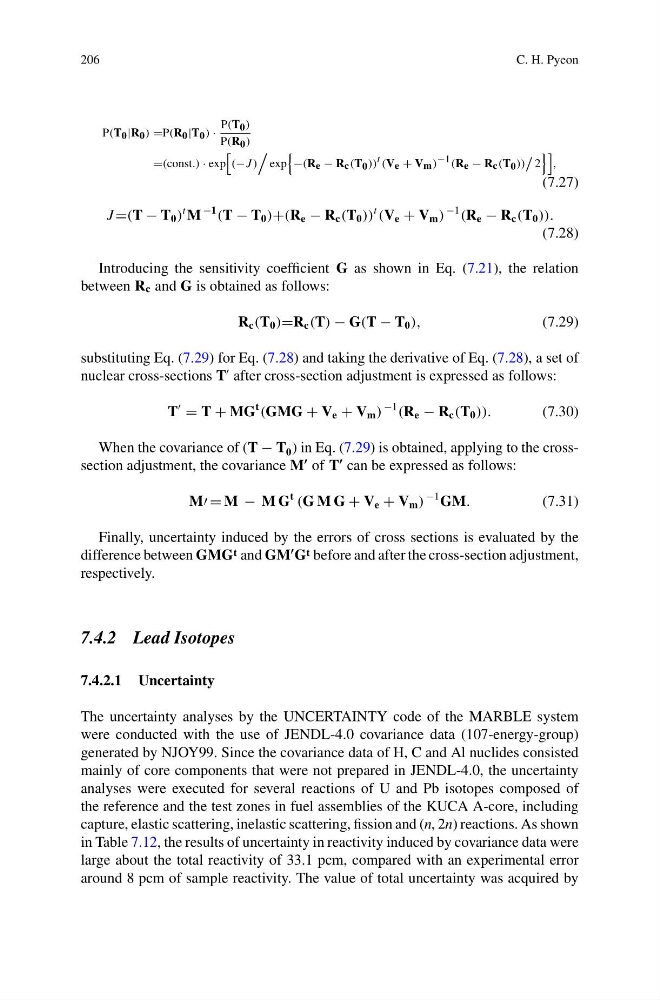
Introducing the sensitivity coefficient G as shown in Eq. (7.21), the relation
between R c and G is obtained as follows:
R c (T 0 )=R c (T) − G(T − T 0 ),
(7.29)
substituting Eq. (7.29) for Eq. (7.28) and taking the derivative of Eq. (7.28), a set of
nuclear cross-sections T
after cross-section adjustment is expressed as follows:
T
= T + MG
t
(GMG + V e + V m )
−1
(R e − R c (T 0 )).
(7.30)
When the covariance of (T − T 0 ) in Eq. (7.29) is obtained, applying to the crosssection adjustment, the covariance M
of T
can be expressed as follows:
M = M − M G
t
(G M G + V e + V m )
−1 GM.
(7.31)
Finally, uncertainty induced by the errors of cross sections is evaluated by the
difference between GMG t and GM
G t before and after the cross-section adjustment,
respectively.
7.4.2 Lead Isotopes
7.4.2.1 Uncertainty
The uncertainty analyses by the UNCERTAINTY code of the MARBLE system
were conducted with the use of JENDL-4.0 covariance data (107-energy-group)
generated by NJOY99. Since the covariance data of H, C and Al nuclides consisted
mainly of core components that were not prepared in JENDL-4.0, the uncertainty
analyses were executed for several reactions of U and Pb isotopes composed of
the reference and the test zones in fuel assemblies of the KUCA A-core, including
capture, elastic scattering, inelastic scattering, fission and (n, 2n) reactions. As shown
in Table 7.12, the results of uncertainty in reactivity induced by covariance data were
large about the total reactivity of 33.1 pcm, compared with an experimental error
around 8 pcm of sample reactivity. The value of total uncertainty was acquired by
C. H. Pyeon
P(T 0 |R 0 ) =P(R 0 |T 0 ) ·
P(T 0 )
P(R 0 )
=(const.) · exp
(−J )
exp
−(R e − R c (T 0 )) t (V e + V m ) −1 (R e − R c (T 0 ))
2
,
(7.27)
J =(T − T 0 )
t M
−1
(T − T 0 )+(R e − R c (T 0 ))
t
(V e + V m )
−1
(R e − R c (T 0 )).
(7.28)
Introducing the sensitivity coefficient G as shown in Eq. (7.21), the relation
between R c and G is obtained as follows:
R c (T 0 )=R c (T) − G(T − T 0 ),
(7.29)
substituting Eq. (7.29) for Eq. (7.28) and taking the derivative of Eq. (7.28), a set of
nuclear cross-sections T
after cross-section adjustment is expressed as follows:
T
= T + MG
t
(GMG + V e + V m )
−1
(R e − R c (T 0 )).
(7.30)
When the covariance of (T − T 0 ) in Eq. (7.29) is obtained, applying to the crosssection adjustment, the covariance M
of T
can be expressed as follows:
M = M − M G
t
(G M G + V e + V m )
−1 GM.
(7.31)
Finally, uncertainty induced by the errors of cross sections is evaluated by the
difference between GMG t and GM
G t before and after the cross-section adjustment,
respectively.
7.4.2 Lead Isotopes
7.4.2.1 Uncertainty
The uncertainty analyses by the UNCERTAINTY code of the MARBLE system
were conducted with the use of JENDL-4.0 covariance data (107-energy-group)
generated by NJOY99. Since the covariance data of H, C and Al nuclides consisted
mainly of core components that were not prepared in JENDL-4.0, the uncertainty
analyses were executed for several reactions of U and Pb isotopes composed of
the reference and the test zones in fuel assemblies of the KUCA A-core, including
capture, elastic scattering, inelastic scattering, fission and (n, 2n) reactions. As shown
in Table 7.12, the results of uncertainty in reactivity induced by covariance data were
large about the total reactivity of 33.1 pcm, compared with an experimental error
around 8 pcm of sample reactivity. The value of total uncertainty was acquired by