

7 Neutronics of Lead and Bismuth
193
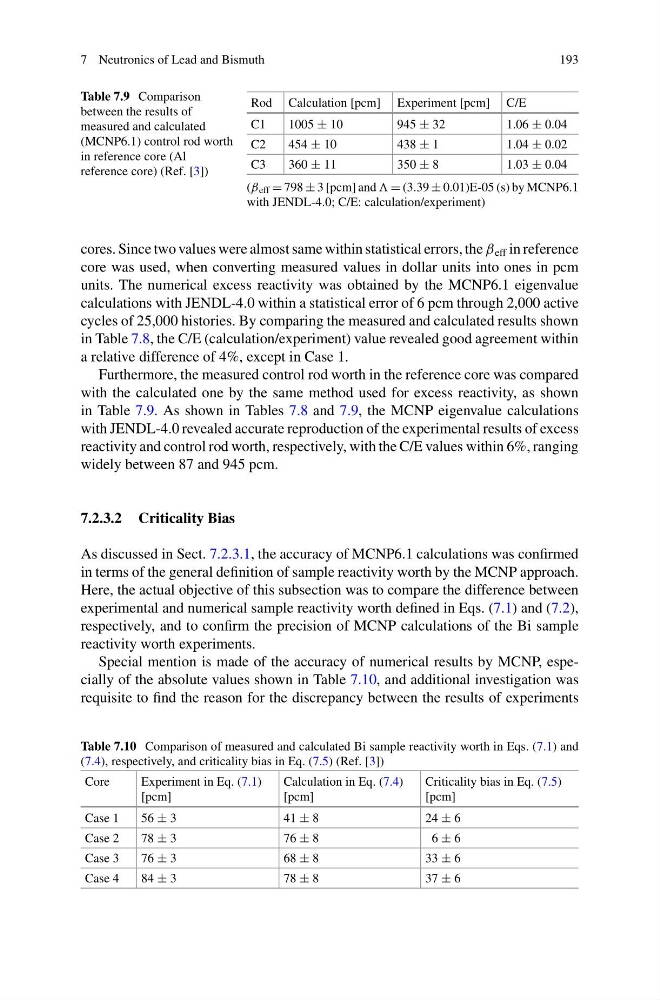
Table 7.9 Comparison
between the results of
measured and calculated
(MCNP6.1) control rod worth
in reference core (Al
reference core) (Ref. [3])
Rod Calculation [pcm] Experiment [pcm] C/E
C1
1005 ± 10
945 ± 32
1.06 ± 0.04
C2
454 ± 10
438 ± 1
1.04 ± 0.02
C3
360 ± 11
350 ± 8
1.03 ± 0.04
(β eff = 798 ± 3 [pcm] and = (3.39 ± 0.01)E-05 (s) by MCNP6.1
with JENDL-4.0; C/E: calculation/experiment)
cores. Since two values were almost same within statistical errors, the β eff in reference
core was used, when converting measured values in dollar units into ones in pcm
units. The numerical excess reactivity was obtained by the MCNP6.1 eigenvalue
calculations with JENDL-4.0 within a statistical error of 6 pcm through 2,000 active
cycles of 25,000 histories. By comparing the measured and calculated results shown
in Table 7.8, the C/E (calculation/experiment) value revealed good agreement within
a relative difference of 4%, except in Case 1.
Furthermore, the measured control rod worth in the reference core was compared
with the calculated one by the same method used for excess reactivity, as shown
in Table 7.9. As shown in Tables 7.8 and 7.9, the MCNP eigenvalue calculations
with JENDL-4.0 revealed accurate reproduction of the experimental results of excess
reactivity and control rod worth, respectively, with the C/E values within 6%, ranging
widely between 87 and 945 pcm.
7.2.3.2 Criticality Bias
As discussed in Sect. 7.2.3.1, the accuracy of MCNP6.1 calculations was confirmed
in terms of the general definition of sample reactivity worth by the MCNP approach.
Here, the actual objective of this subsection was to compare the difference between
experimental and numerical sample reactivity worth defined in Eqs. (7.1) and (7.2),
respectively, and to confirm the precision of MCNP calculations of the Bi sample
reactivity worth experiments.
Special mention is made of the accuracy of numerical results by MCNP, especially of the absolute values shown in Table 7.10, and additional investigation was
requisite to find the reason for the discrepancy between the results of experiments
Table 7.10 Comparison of measured and calculated Bi sample reactivity worth in Eqs. (7.1) and
(7.4), respectively, and criticality bias in Eq. (7.5) (Ref. [3])
Core
Experiment in Eq. (7.1)
[pcm]
Calculation in Eq. (7.4)
[pcm]
Criticality bias in Eq. (7.5)
[pcm]
Case 1
56 ± 3
41 ± 8
24 ± 6
Case 2
78 ± 3
76 ± 8
6 ± 6
Case 3
76 ± 3
68 ± 8
33 ± 6
Case 4
84 ± 3
78 ± 8
37 ± 6
193
Table 7.9 Comparison
between the results of
measured and calculated
(MCNP6.1) control rod worth
in reference core (Al
reference core) (Ref. [3])
Rod Calculation [pcm] Experiment [pcm] C/E
C1
1005 ± 10
945 ± 32
1.06 ± 0.04
C2
454 ± 10
438 ± 1
1.04 ± 0.02
C3
360 ± 11
350 ± 8
1.03 ± 0.04
(β eff = 798 ± 3 [pcm] and = (3.39 ± 0.01)E-05 (s) by MCNP6.1
with JENDL-4.0; C/E: calculation/experiment)
cores. Since two values were almost same within statistical errors, the β eff in reference
core was used, when converting measured values in dollar units into ones in pcm
units. The numerical excess reactivity was obtained by the MCNP6.1 eigenvalue
calculations with JENDL-4.0 within a statistical error of 6 pcm through 2,000 active
cycles of 25,000 histories. By comparing the measured and calculated results shown
in Table 7.8, the C/E (calculation/experiment) value revealed good agreement within
a relative difference of 4%, except in Case 1.
Furthermore, the measured control rod worth in the reference core was compared
with the calculated one by the same method used for excess reactivity, as shown
in Table 7.9. As shown in Tables 7.8 and 7.9, the MCNP eigenvalue calculations
with JENDL-4.0 revealed accurate reproduction of the experimental results of excess
reactivity and control rod worth, respectively, with the C/E values within 6%, ranging
widely between 87 and 945 pcm.
7.2.3.2 Criticality Bias
As discussed in Sect. 7.2.3.1, the accuracy of MCNP6.1 calculations was confirmed
in terms of the general definition of sample reactivity worth by the MCNP approach.
Here, the actual objective of this subsection was to compare the difference between
experimental and numerical sample reactivity worth defined in Eqs. (7.1) and (7.2),
respectively, and to confirm the precision of MCNP calculations of the Bi sample
reactivity worth experiments.
Special mention is made of the accuracy of numerical results by MCNP, especially of the absolute values shown in Table 7.10, and additional investigation was
requisite to find the reason for the discrepancy between the results of experiments
Table 7.10 Comparison of measured and calculated Bi sample reactivity worth in Eqs. (7.1) and
(7.4), respectively, and criticality bias in Eq. (7.5) (Ref. [3])
Core
Experiment in Eq. (7.1)
[pcm]
Calculation in Eq. (7.4)
[pcm]
Criticality bias in Eq. (7.5)
[pcm]
Case 1
56 ± 3
41 ± 8
24 ± 6
Case 2
78 ± 3
76 ± 8
6 ± 6
Case 3
76 ± 3
68 ± 8
33 ± 6
Case 4
84 ± 3
78 ± 8
37 ± 6