

184
C. H. Pyeon
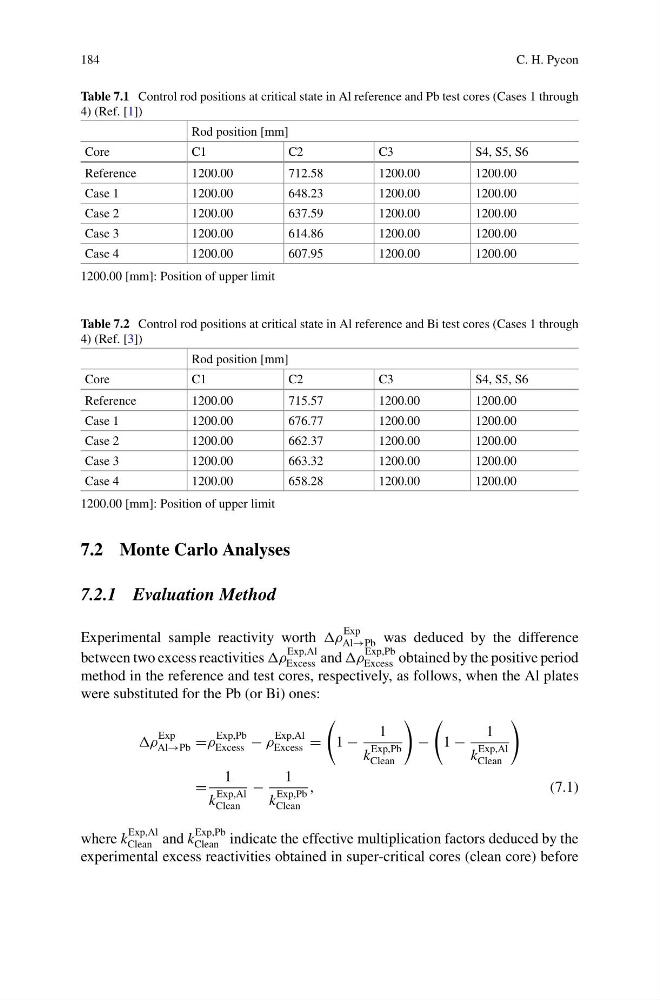
Table 7.1 Control rod positions at critical state in Al reference and Pb test cores (Cases 1 through
4) (Ref. [1])
Rod position [mm]
Core
C1
C2
C3
S4, S5, S6
Reference
1200.00
712.58
1200.00
1200.00
Case 1
1200.00
648.23
1200.00
1200.00
Case 2
1200.00
637.59
1200.00
1200.00
Case 3
1200.00
614.86
1200.00
1200.00
Case 4
1200.00
607.95
1200.00
1200.00
1200.00 [mm]: Position of upper limit
Table 7.2 Control rod positions at critical state in Al reference and Bi test cores (Cases 1 through
4) (Ref. [3])
Rod position [mm]
Core
C1
C2
C3
S4, S5, S6
Reference
1200.00
715.57
1200.00
1200.00
Case 1
1200.00
676.77
1200.00
1200.00
Case 2
1200.00
662.37
1200.00
1200.00
Case 3
1200.00
663.32
1200.00
1200.00
Case 4
1200.00
658.28
1200.00
1200.00
1200.00 [mm]: Position of upper limit
7.2 Monte Carlo Analyses
7.2.1 Evaluation Method
Experimental sample reactivity worth ρ
Exp
Al→Pb was deduced by the difference
between two excess reactivities ρ
Exp,Al
Excess and ρ
Exp,Pb
Excess obtained by the positive period
method in the reference and test cores, respectively, as follows, when the Al plates
were substituted for the Pb (or Bi) ones:
ρ
Exp
Al→Pb =ρ
Exp,Pb
Excess − ρ
Exp,Al
Excess =
1 −
1
k
Exp,Pb
Clean
−
1 −
1
k
Exp,Al
Clean
=
1
k
Exp,Al
Clean
−
1
k
Exp,Pb
Clean
,
(7.1)
where k
Exp,Al
Clean and k
Exp,Pb
Clean indicate the effective multiplication factors deduced by the
experimental excess reactivities obtained in super-critical cores (clean core) before
C. H. Pyeon
Table 7.1 Control rod positions at critical state in Al reference and Pb test cores (Cases 1 through
4) (Ref. [1])
Rod position [mm]
Core
C1
C2
C3
S4, S5, S6
Reference
1200.00
712.58
1200.00
1200.00
Case 1
1200.00
648.23
1200.00
1200.00
Case 2
1200.00
637.59
1200.00
1200.00
Case 3
1200.00
614.86
1200.00
1200.00
Case 4
1200.00
607.95
1200.00
1200.00
1200.00 [mm]: Position of upper limit
Table 7.2 Control rod positions at critical state in Al reference and Bi test cores (Cases 1 through
4) (Ref. [3])
Rod position [mm]
Core
C1
C2
C3
S4, S5, S6
Reference
1200.00
715.57
1200.00
1200.00
Case 1
1200.00
676.77
1200.00
1200.00
Case 2
1200.00
662.37
1200.00
1200.00
Case 3
1200.00
663.32
1200.00
1200.00
Case 4
1200.00
658.28
1200.00
1200.00
1200.00 [mm]: Position of upper limit
7.2 Monte Carlo Analyses
7.2.1 Evaluation Method
Experimental sample reactivity worth ρ
Exp
Al→Pb was deduced by the difference
between two excess reactivities ρ
Exp,Al
Excess and ρ
Exp,Pb
Excess obtained by the positive period
method in the reference and test cores, respectively, as follows, when the Al plates
were substituted for the Pb (or Bi) ones:
ρ
Exp
Al→Pb =ρ
Exp,Pb
Excess − ρ
Exp,Al
Excess =
1 −
1
k
Exp,Pb
Clean
−
1 −
1
k
Exp,Al
Clean
=
1
k
Exp,Al
Clean
−
1
k
Exp,Pb
Clean
,
(7.1)
where k
Exp,Al
Clean and k
Exp,Pb
Clean indicate the effective multiplication factors deduced by the
experimental excess reactivities obtained in super-critical cores (clean core) before