

132
C. H. Pyeon
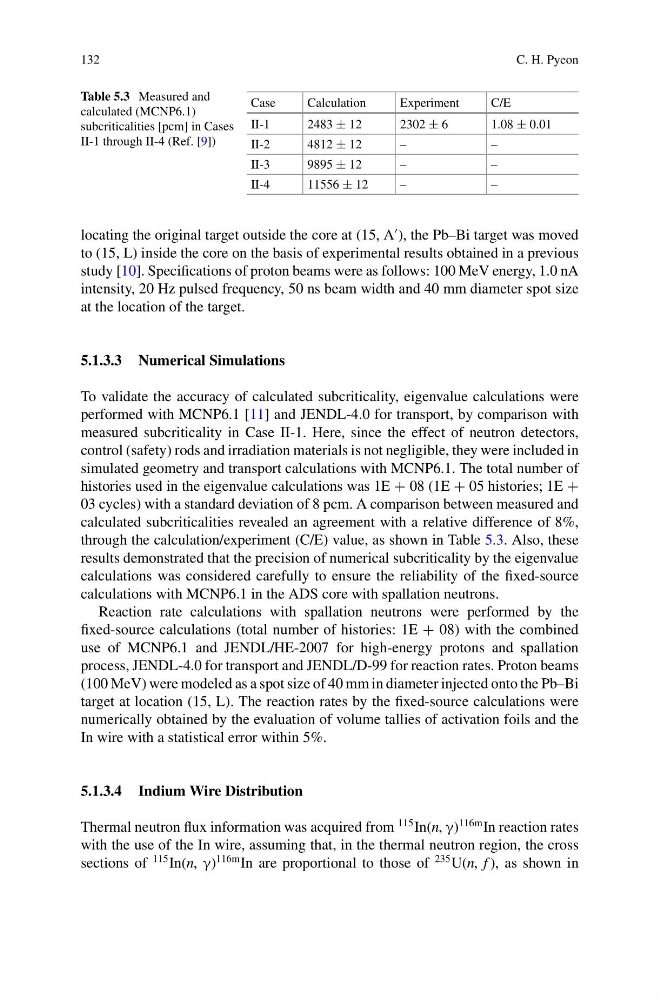
Table 5.3 Measured and
calculated (MCNP6.1)
subcriticalities [pcm] in Cases
II-1 through II-4 (Ref. [9])
Case
Calculation
Experiment
C/E
II-1
2483 ± 12
2302 ± 6
1.08 ± 0.01
II-2
4812 ± 12
–
–
II-3
9895 ± 12
–
–
II-4
11556 ± 12
–
–
locating the original target outside the core at (15, A
), the Pb–Bi target was moved
to (15, L) inside the core on the basis of experimental results obtained in a previous
study [10]. Specifications of proton beams were as follows: 100 MeV energy, 1.0 nA
intensity, 20 Hz pulsed frequency, 50 ns beam width and 40 mm diameter spot size
at the location of the target.
5.1.3.3 Numerical Simulations
To validate the accuracy of calculated subcriticality, eigenvalue calculations were
performed with MCNP6.1 [11] and JENDL-4.0 for transport, by comparison with
measured subcriticality in Case II-1. Here, since the effect of neutron detectors,
control (safety) rods and irradiation materials is not negligible, they were included in
simulated geometry and transport calculations with MCNP6.1. The total number of
histories used in the eigenvalue calculations was 1E + 08 (1E + 05 histories; 1E +
03 cycles) with a standard deviation of 8 pcm. A comparison between measured and
calculated subcriticalities revealed an agreement with a relative difference of 8%,
through the calculation/experiment (C/E) value, as shown in Table 5.3. Also, these
results demonstrated that the precision of numerical subcriticality by the eigenvalue
calculations was considered carefully to ensure the reliability of the fixed-source
calculations with MCNP6.1 in the ADS core with spallation neutrons.
Reaction rate calculations with spallation neutrons were performed by the
fixed-source calculations (total number of histories: 1E + 08) with the combined
use of MCNP6.1 and JENDL/HE-2007 for high-energy protons and spallation
process, JENDL-4.0 for transport and JENDL/D-99 for reaction rates. Proton beams
(100 MeV) were modeled as a spot size of 40 mm in diameter injected onto the Pb–Bi
target at location (15, L). The reaction rates by the fixed-source calculations were
numerically obtained by the evaluation of volume tallies of activation foils and the
In wire with a statistical error within 5%.
5.1.3.4 Indium Wire Distribution
Thermal neutron flux information was acquired from
115 In(n, γ)
116m In reaction rates
with the use of the In wire, assuming that, in the thermal neutron region, the cross
sections of
115 In(n, γ)
116m In are proportional to those of
235 U(n, f ), as shown in
C. H. Pyeon
Table 5.3 Measured and
calculated (MCNP6.1)
subcriticalities [pcm] in Cases
II-1 through II-4 (Ref. [9])
Case
Calculation
Experiment
C/E
II-1
2483 ± 12
2302 ± 6
1.08 ± 0.01
II-2
4812 ± 12
–
–
II-3
9895 ± 12
–
–
II-4
11556 ± 12
–
–
locating the original target outside the core at (15, A
), the Pb–Bi target was moved
to (15, L) inside the core on the basis of experimental results obtained in a previous
study [10]. Specifications of proton beams were as follows: 100 MeV energy, 1.0 nA
intensity, 20 Hz pulsed frequency, 50 ns beam width and 40 mm diameter spot size
at the location of the target.
5.1.3.3 Numerical Simulations
To validate the accuracy of calculated subcriticality, eigenvalue calculations were
performed with MCNP6.1 [11] and JENDL-4.0 for transport, by comparison with
measured subcriticality in Case II-1. Here, since the effect of neutron detectors,
control (safety) rods and irradiation materials is not negligible, they were included in
simulated geometry and transport calculations with MCNP6.1. The total number of
histories used in the eigenvalue calculations was 1E + 08 (1E + 05 histories; 1E +
03 cycles) with a standard deviation of 8 pcm. A comparison between measured and
calculated subcriticalities revealed an agreement with a relative difference of 8%,
through the calculation/experiment (C/E) value, as shown in Table 5.3. Also, these
results demonstrated that the precision of numerical subcriticality by the eigenvalue
calculations was considered carefully to ensure the reliability of the fixed-source
calculations with MCNP6.1 in the ADS core with spallation neutrons.
Reaction rate calculations with spallation neutrons were performed by the
fixed-source calculations (total number of histories: 1E + 08) with the combined
use of MCNP6.1 and JENDL/HE-2007 for high-energy protons and spallation
process, JENDL-4.0 for transport and JENDL/D-99 for reaction rates. Proton beams
(100 MeV) were modeled as a spot size of 40 mm in diameter injected onto the Pb–Bi
target at location (15, L). The reaction rates by the fixed-source calculations were
numerically obtained by the evaluation of volume tallies of activation foils and the
In wire with a statistical error within 5%.
5.1.3.4 Indium Wire Distribution
Thermal neutron flux information was acquired from
115 In(n, γ)
116m In reaction rates
with the use of the In wire, assuming that, in the thermal neutron region, the cross
sections of
115 In(n, γ)
116m In are proportional to those of
235 U(n, f ), as shown in